Batch Console (9501)
plantpulse-batch-web is the operational console. It shows you, in one view, what the process that receives sensor points and writes them in batch to Aster TSDB is currently doing, how far behind it is, and where it failed.
| Item | Value |
|---|---|
| Address (TLS) | https://<server-ip>:9501/ |
| Default account | admin / admin123! |
| What it does | Reads points from Kafka or Redis and writes them in batch to Aster TSDB · Loads into archive tables |
| What it reads | Its own process's JMX · Dropwizard metrics, metastore (PostgreSQL), eventstore (Aster TSDB) |
admin123! is the shipping default. Change it right after installation — see Password Rotation.
Dashboard
This is the first screen. It shows three things: whether it's writing now, whether it's behind, and where it failed.
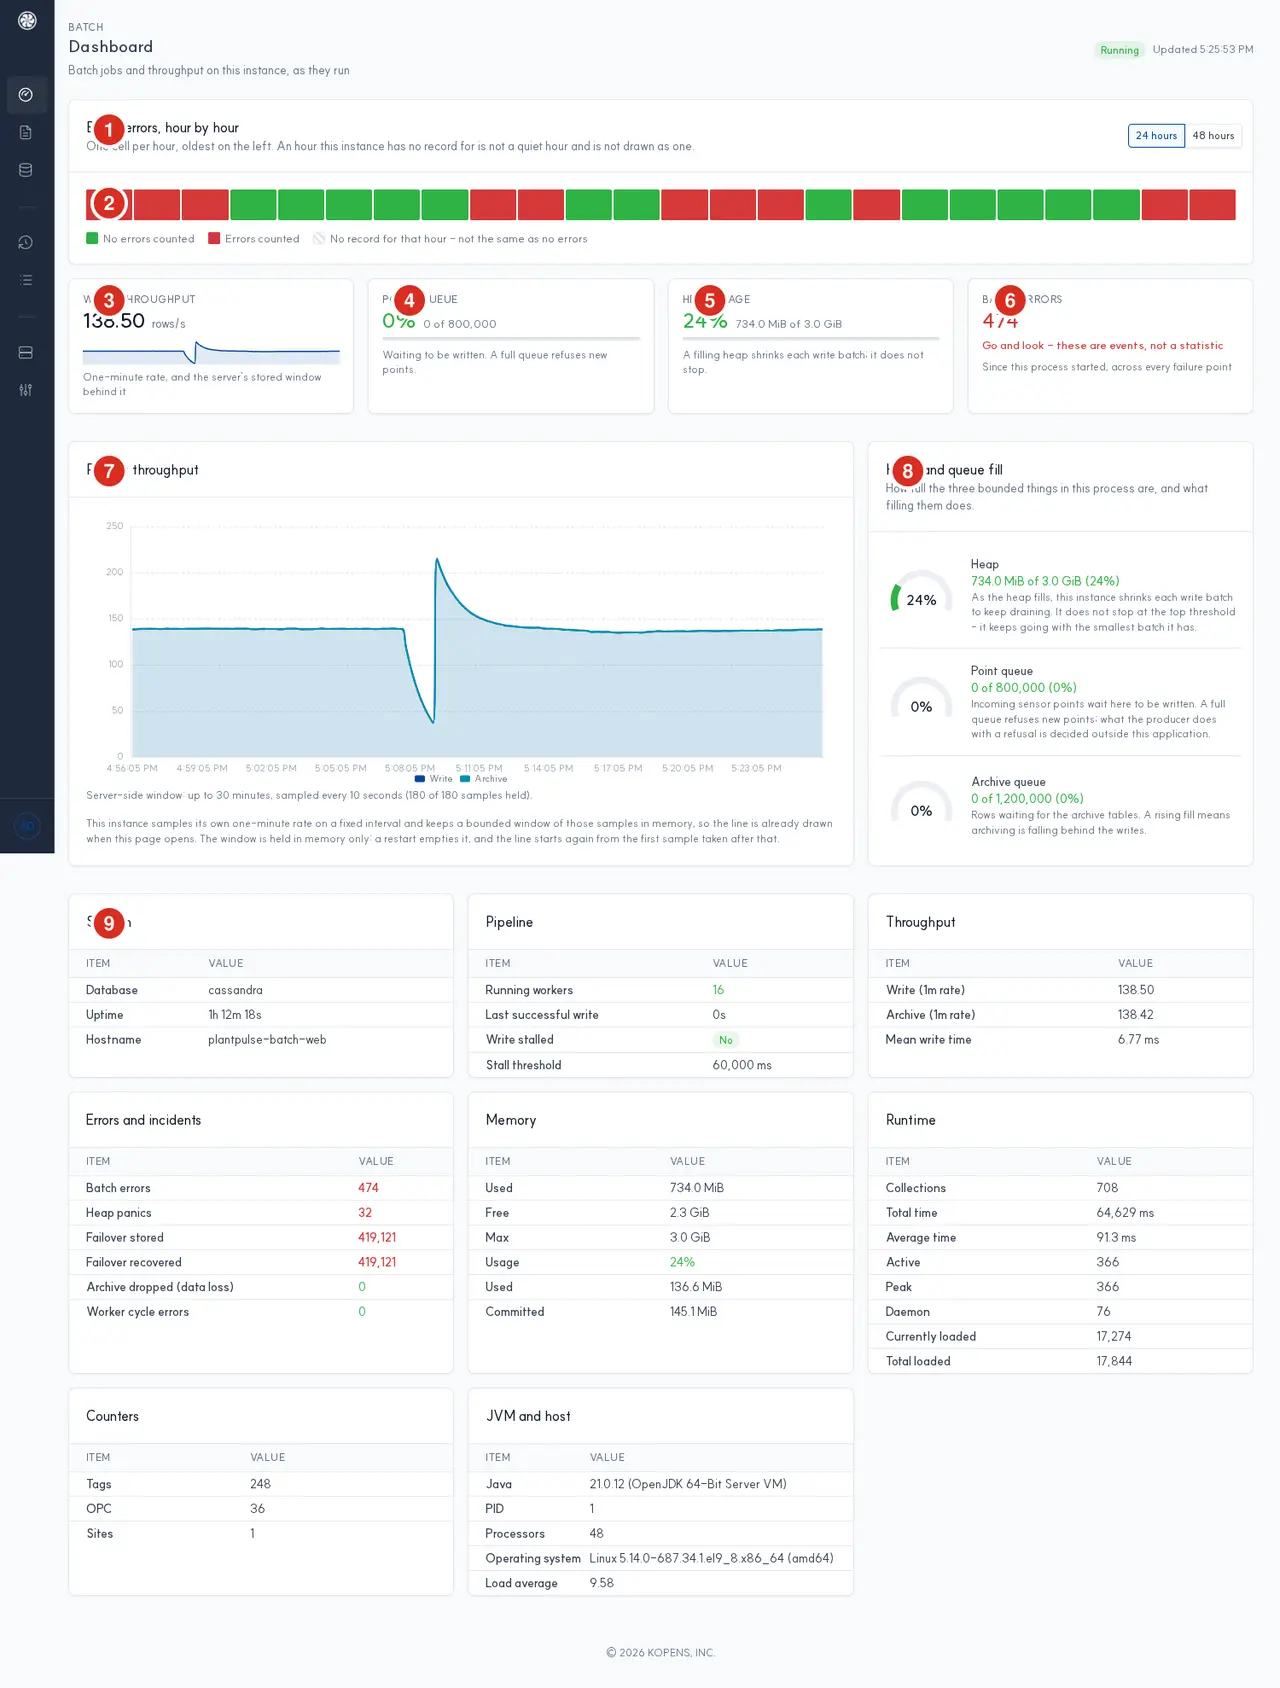
| What you see | What it means |
|---|---|
| Hourly error ribbon | Each cell is one hour. Green means «0 errors», red means «errors present», and a hatch mark means an hour with no records — not that it was quiet, but that this instance wasn't there during that hour |
| Write throughput | 1-minute moving rate (rows/s). The line beside it is the most recent 30-minute window held in server memory |
| Point queue | The slot where incoming points wait to be written. When full, new points are rejected |
| Heap usage | When the heap fills up, it reduces the batch size on its own to keep flowing — it does not stop at the threshold |
| Batch errors | These are not statistics but events. If the value is not 0, look at the logs |
The tables below break down system, pipeline, throughput, errors, memory, runtime, counters, and JVM. If Write stalled is Yes and exceeds Stall threshold (default 60,000 ms), writing has stopped.
Storage
This shows whether the stores this node writes to are responding, and how full the Aster TSDB keyspace is.
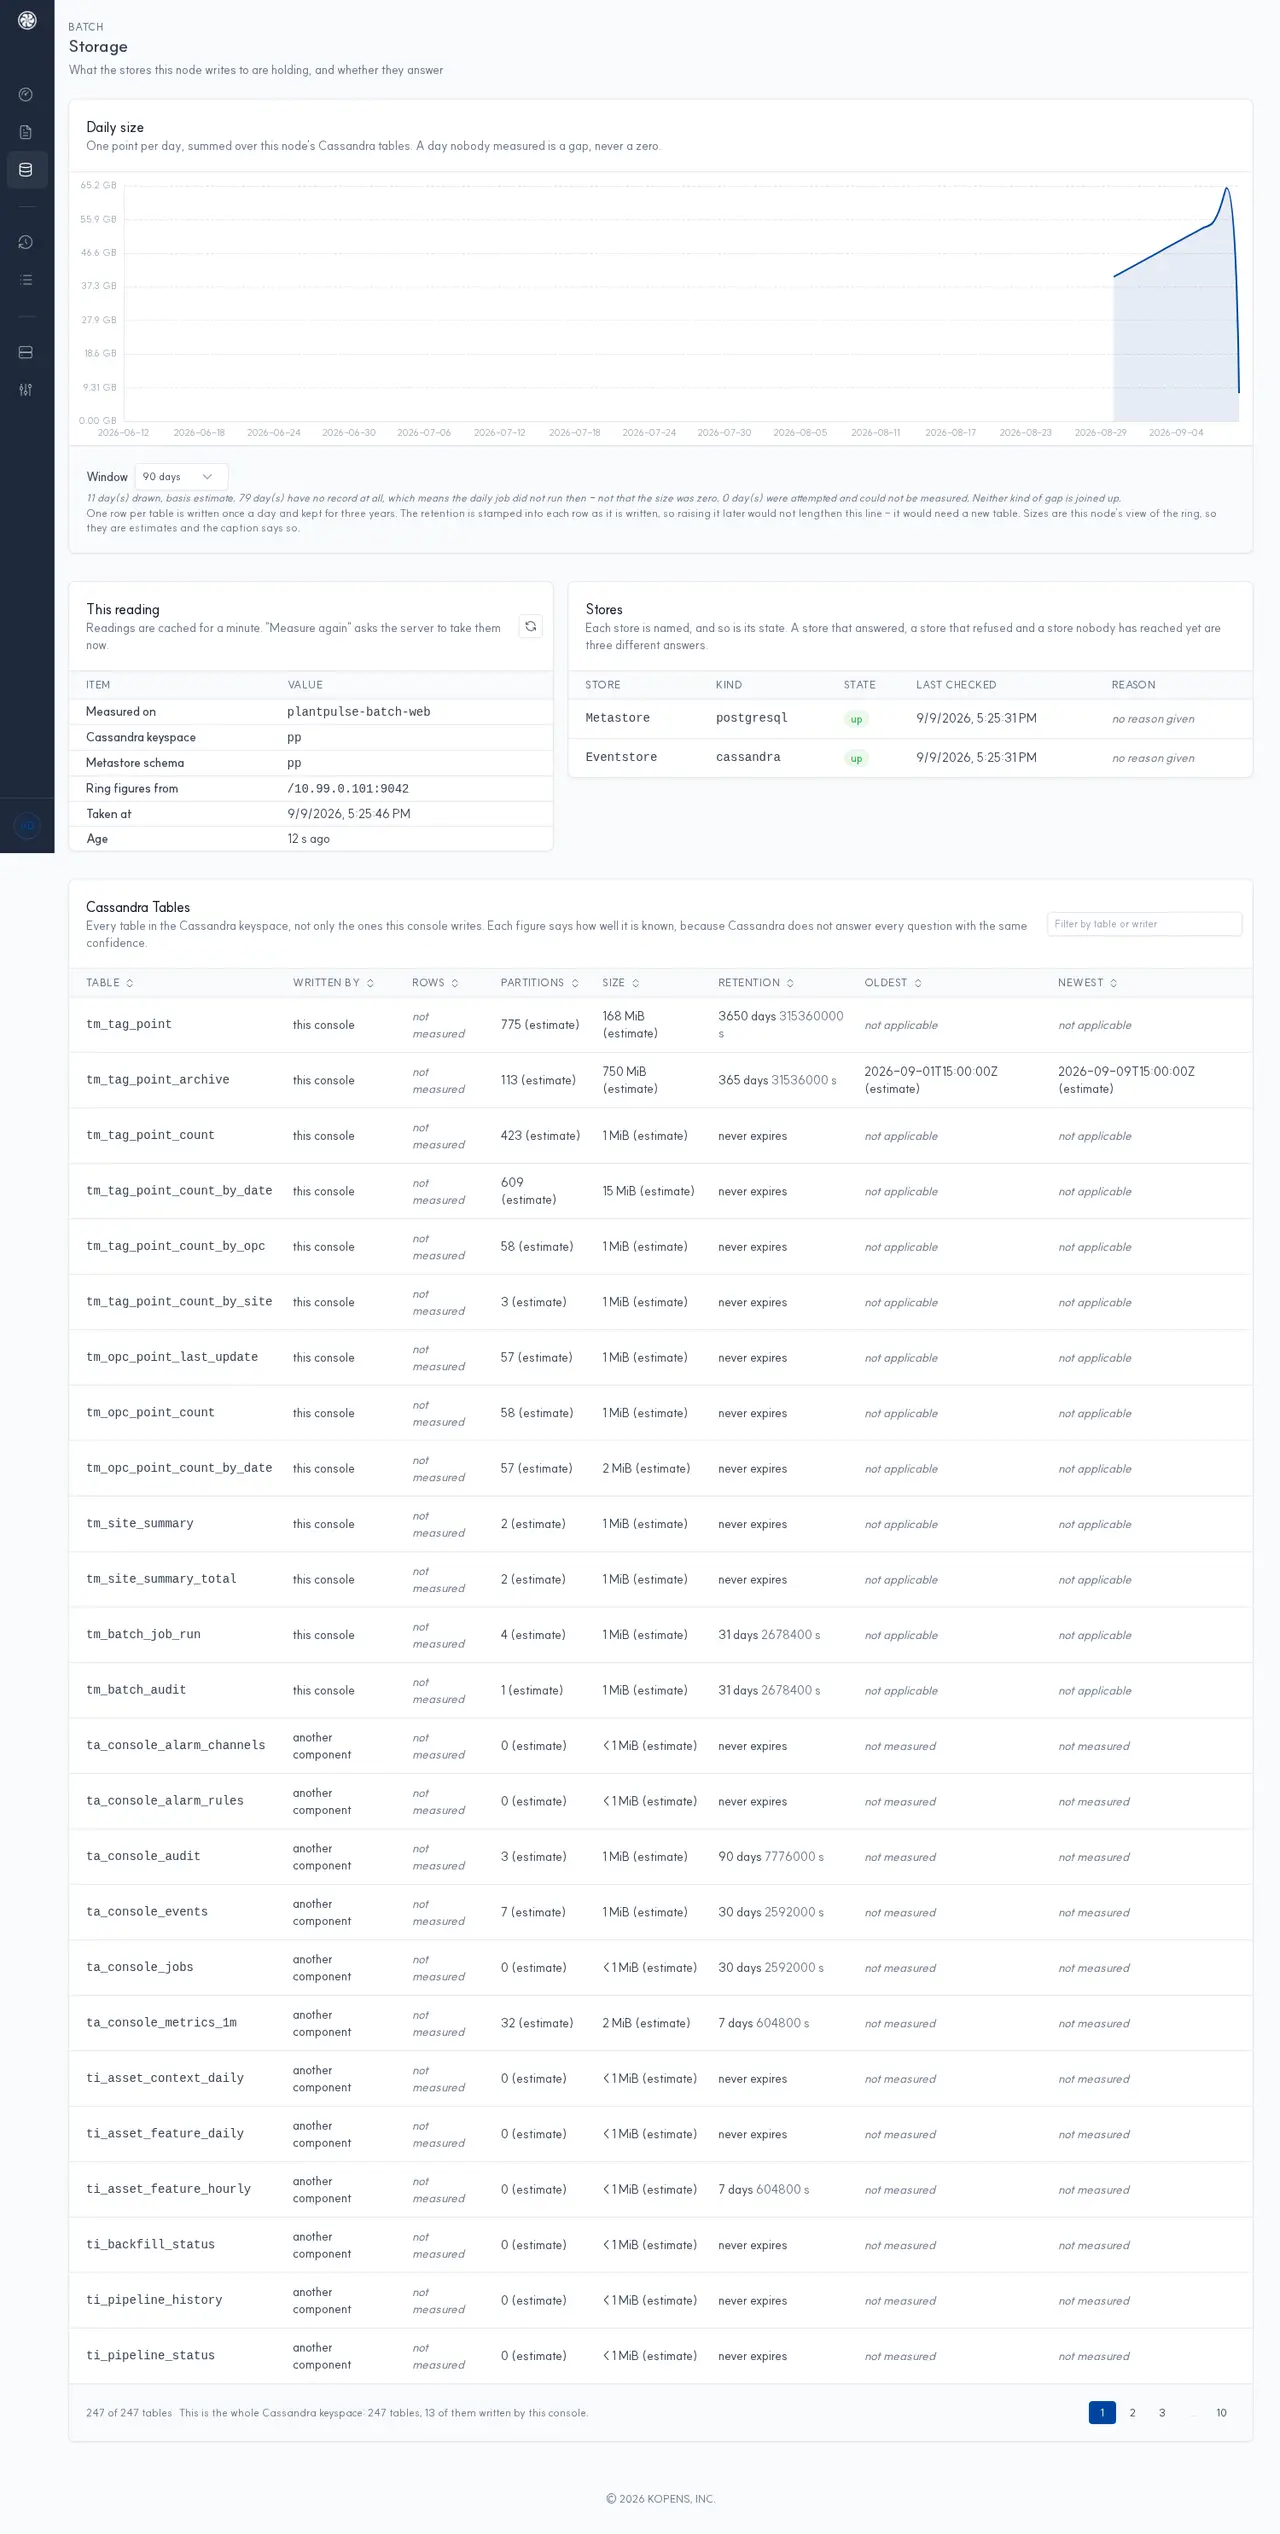
- Daily size — one point per day. Days nobody sampled are left as blank slots, not as 0.
- Stores — Whether
Metastore(PostgreSQL) andEventstore(Aster TSDB) are eachup. It records separately which ones responded, which were rejected, and which were not yet reached. - Aster TSDB Tables — All tables in the keyspace (not just the ones this console uses).
WRITTEN BYdistinguishes which ones this console uses from those other components use. TheRETENTIONcolumn is the actual TTL for each table, and it also notes that most numbers are estimates.
tm_tag_point's RETENTION is shown as 3650 days. To change this value, see Data Retention.
Logs
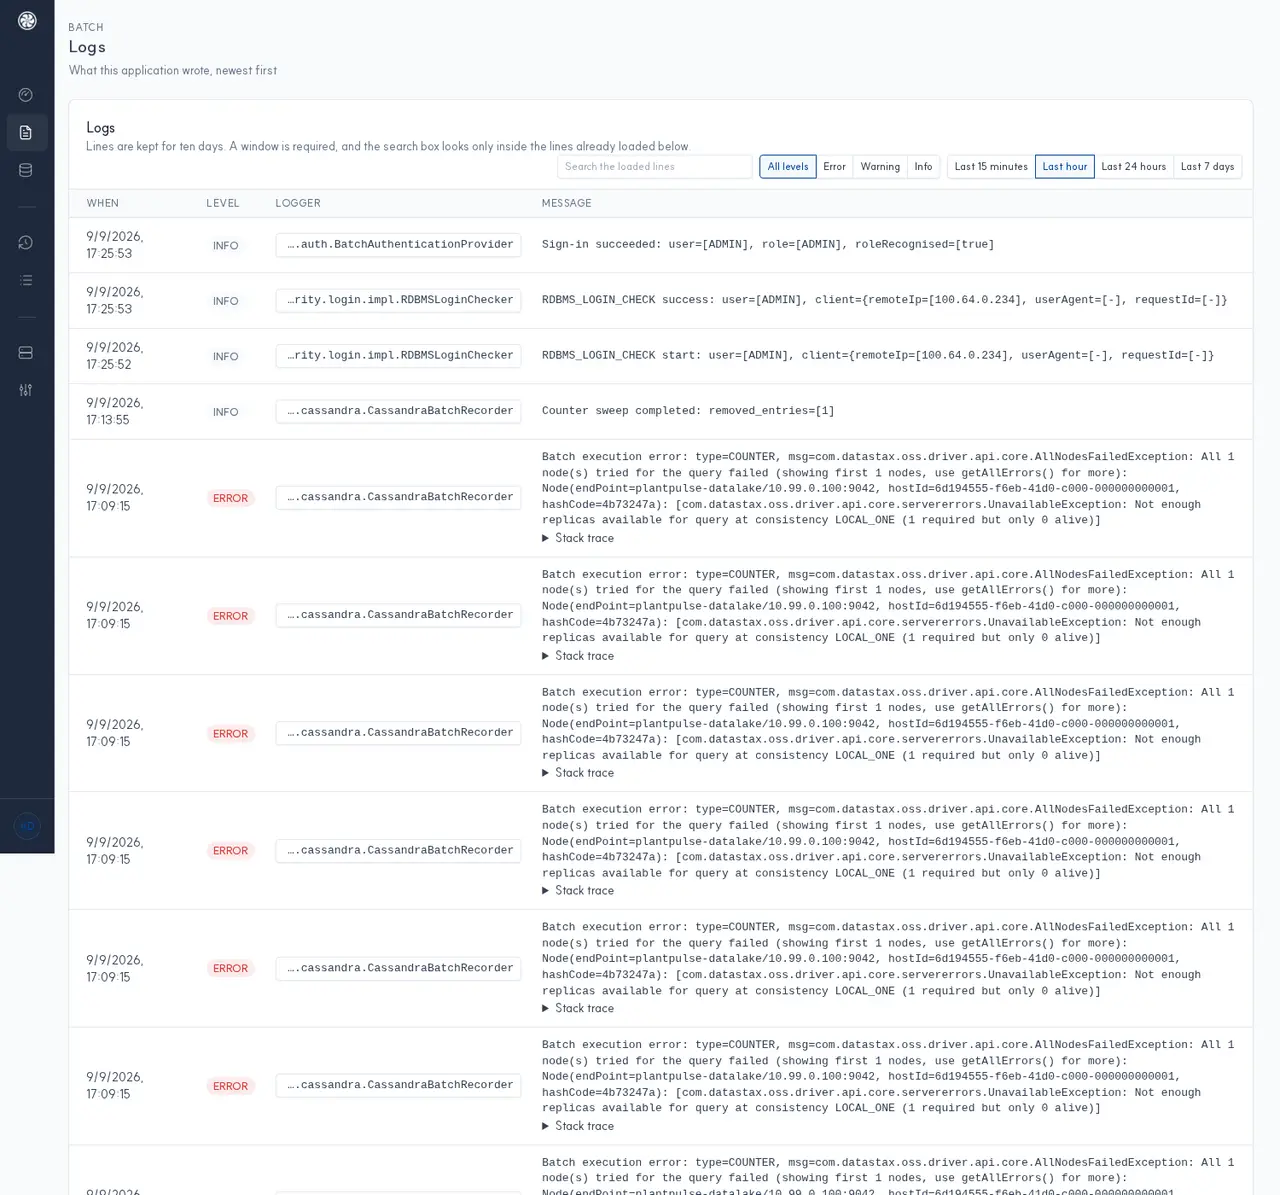
View this process's logs directly in your browser. Use this to check error times without logging into the server.
Job Runs
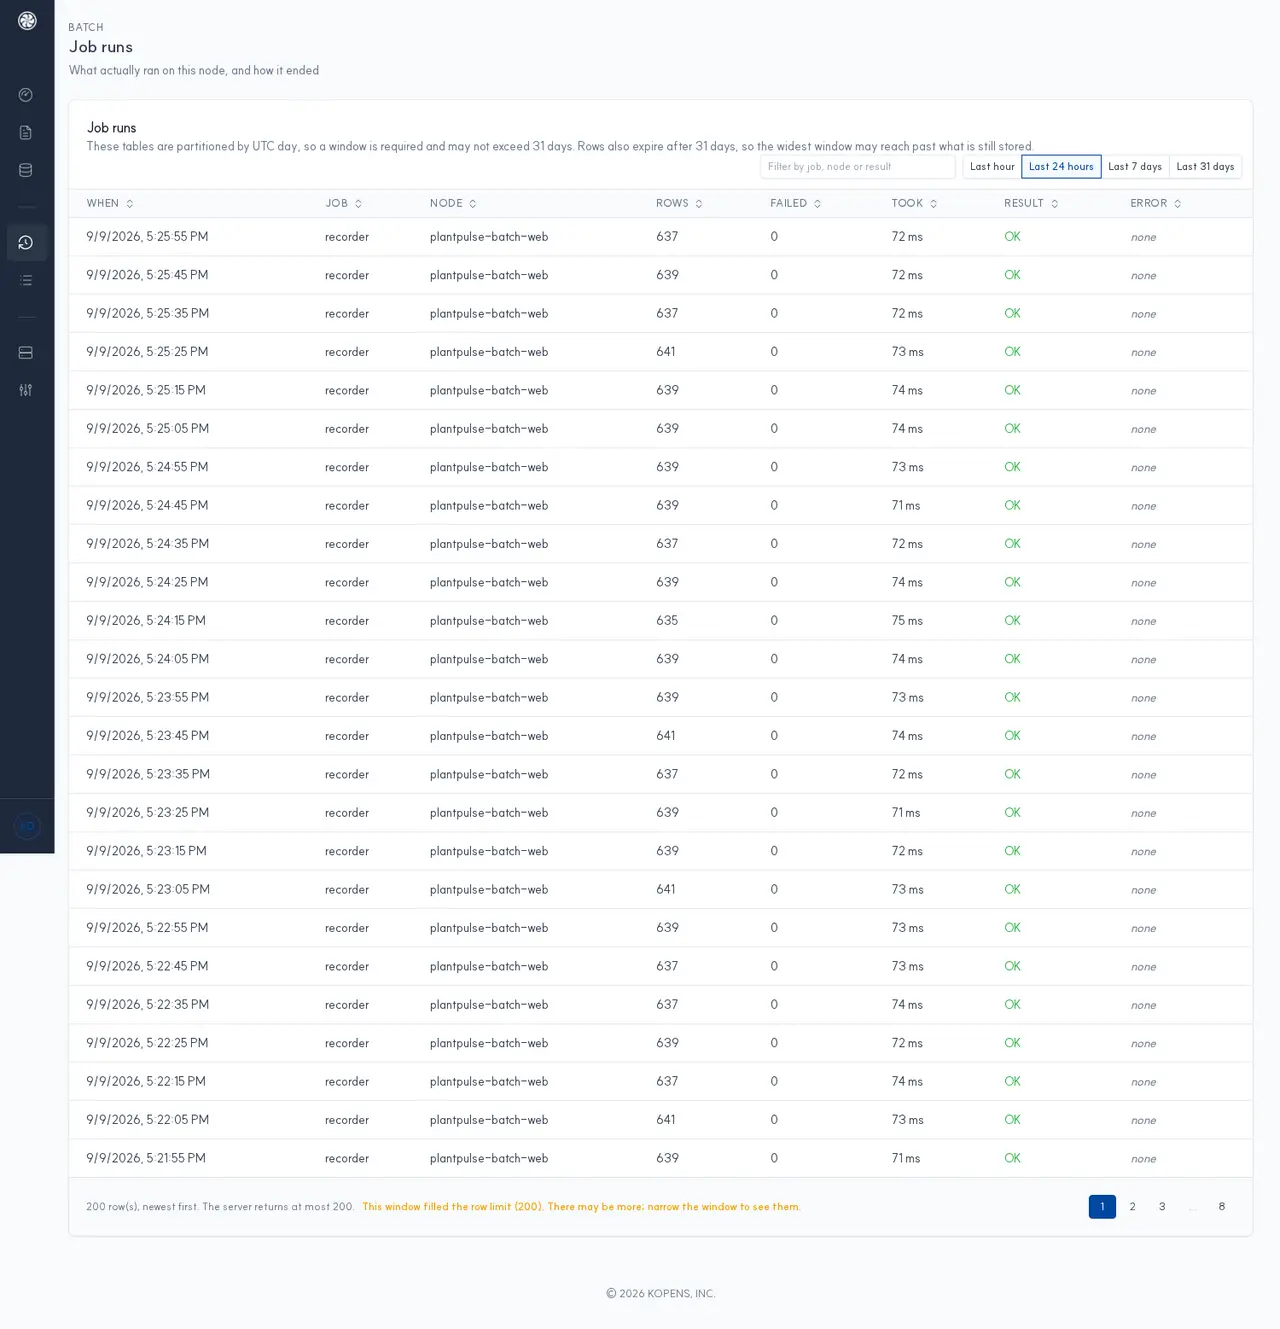
This is the result of the jobs the batch has run. It records when each started and ended, and whether it succeeded or failed.
Change History
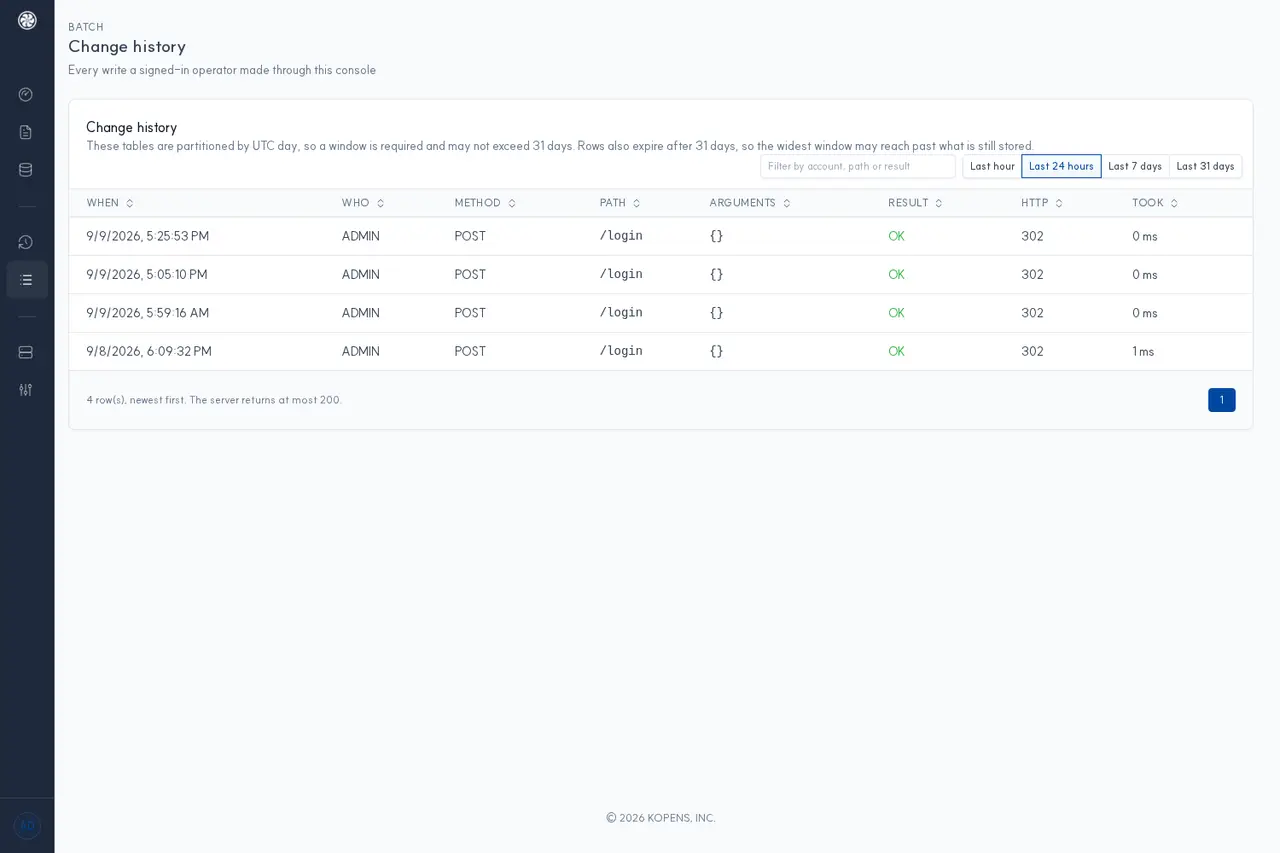
Who changed what in the console, along with the account, is recorded here. Every settings toggle is logged in its entirety.
Nodes
This shows which component runs on which box.
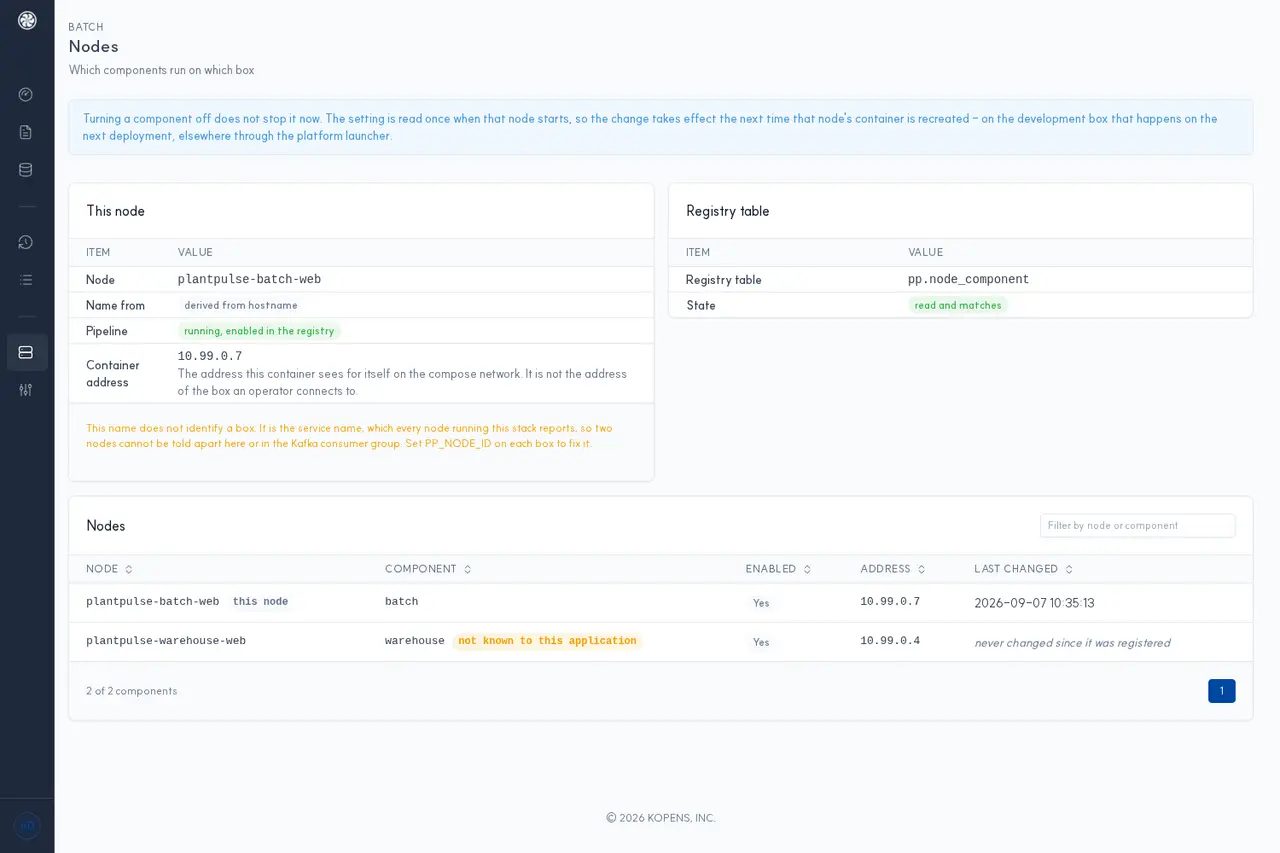
Node is a service name derived from the hostname. If multiple nodes are running the same stack, they won't be distinguishable here or in the Kafka consumer group. Specify PP_NODE_ID for each box.
Turning off a component does not stop it immediately. Settings are read once when that node starts up, so they take effect the next time the container is recreated.
Settings
This is a read-only screen that shows what this deployment was started with.
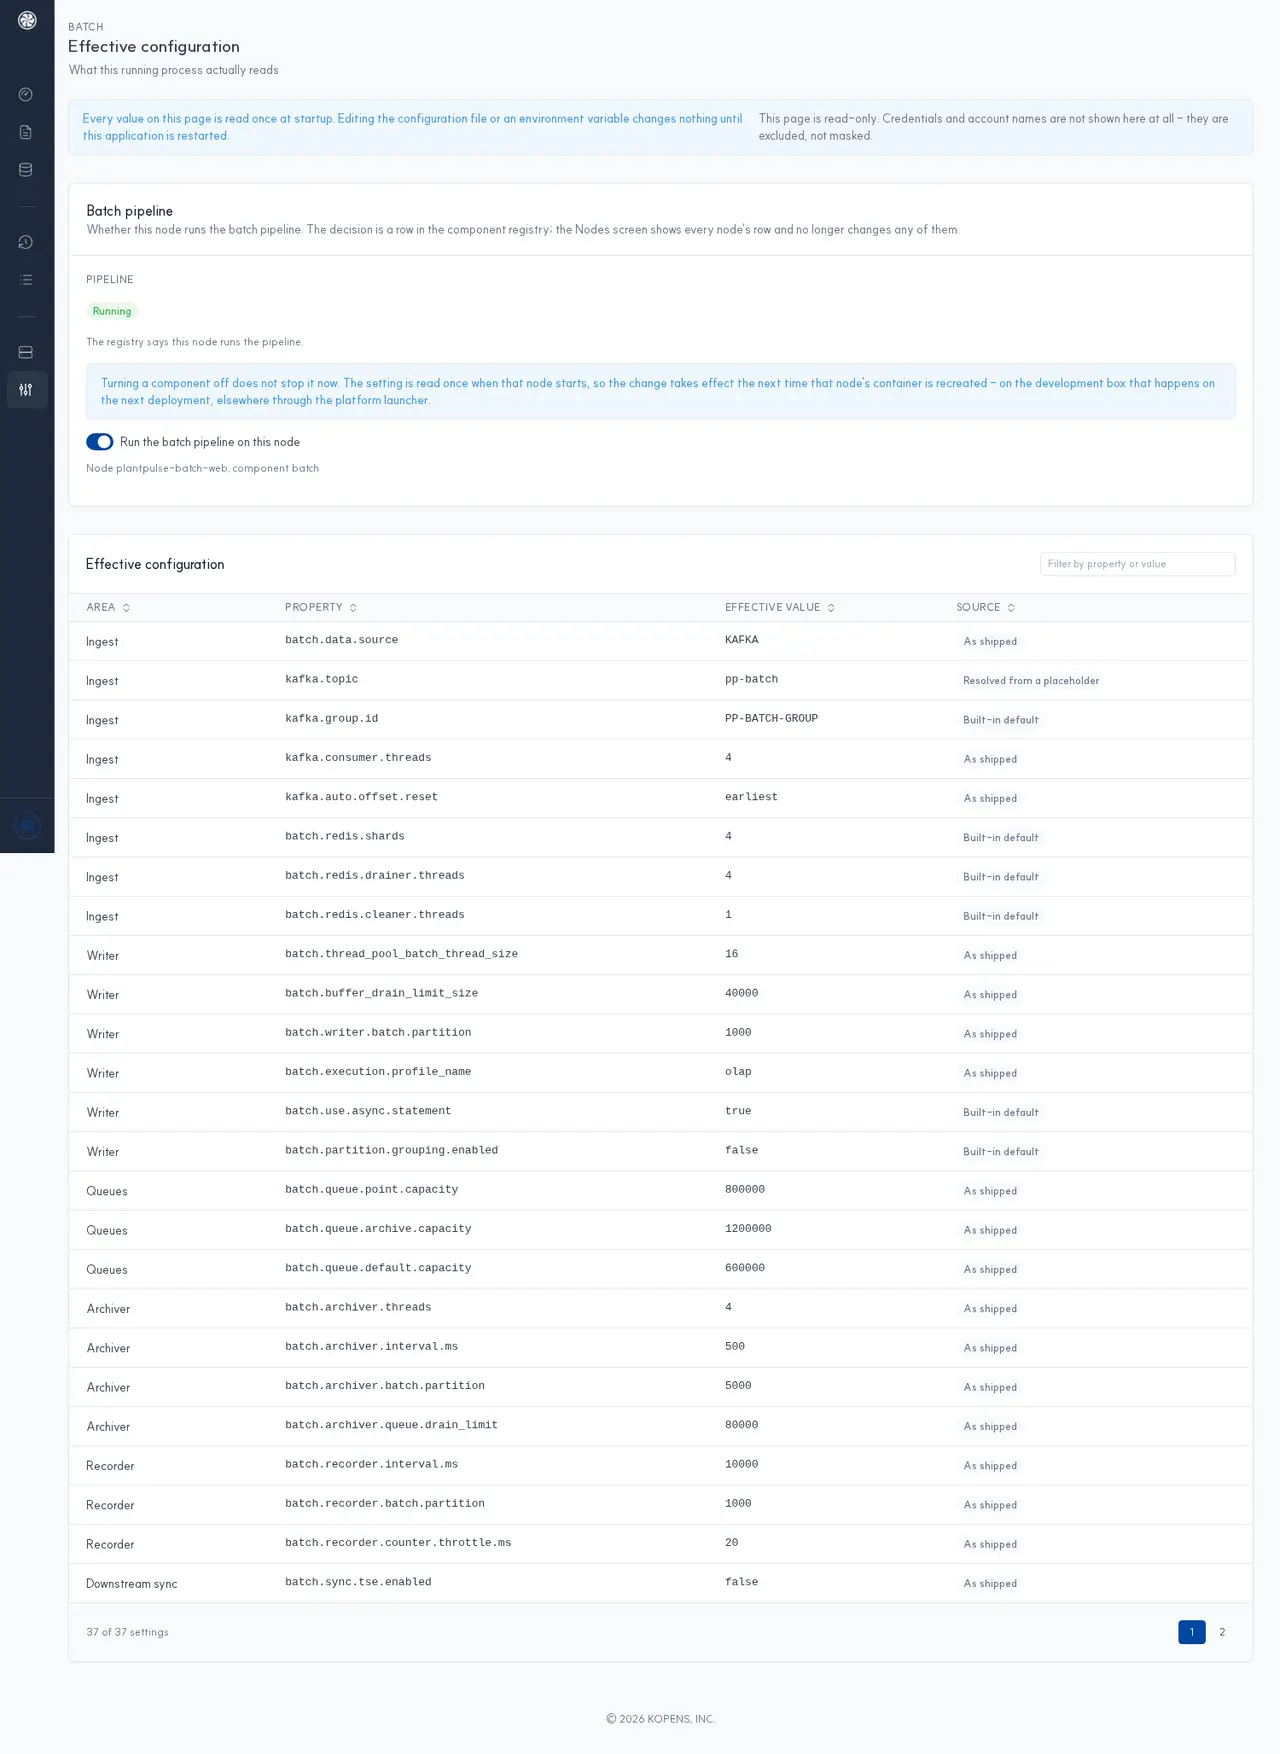
Values are read once at startup. Changing a config file or environment variable changes nothing until this application is restarted. Passwords and account names are not masked — they are excluded from the list.
See Also
Warehouse Console (9601) Data Lake Management Console Data Retention