Warehouse Console (9601)
plantpulse-warehouse-web's operational console. It shows whether the archive job that moves data from the
Event Store (Aster TSDB) to the Analytics Store (Iceberg) before it expires ran on
time, and what has accumulated in the cold tier.
| Item | Value |
|---|---|
| Address (TLS) | https://<server-ip>:9601/ |
| Default account | admin / admin123! |
| What it does | Aster TSDB → Iceberg archive · Iceberg table optimization |
| Who controls the schedule | Workflow Service (Temporal) — not this process's memory |
admin123! is the factory default. Change it immediately after installation —
see Password Rotation.
Dashboard
When the last archive finished, when the next one is, and whether any recent runs failed.
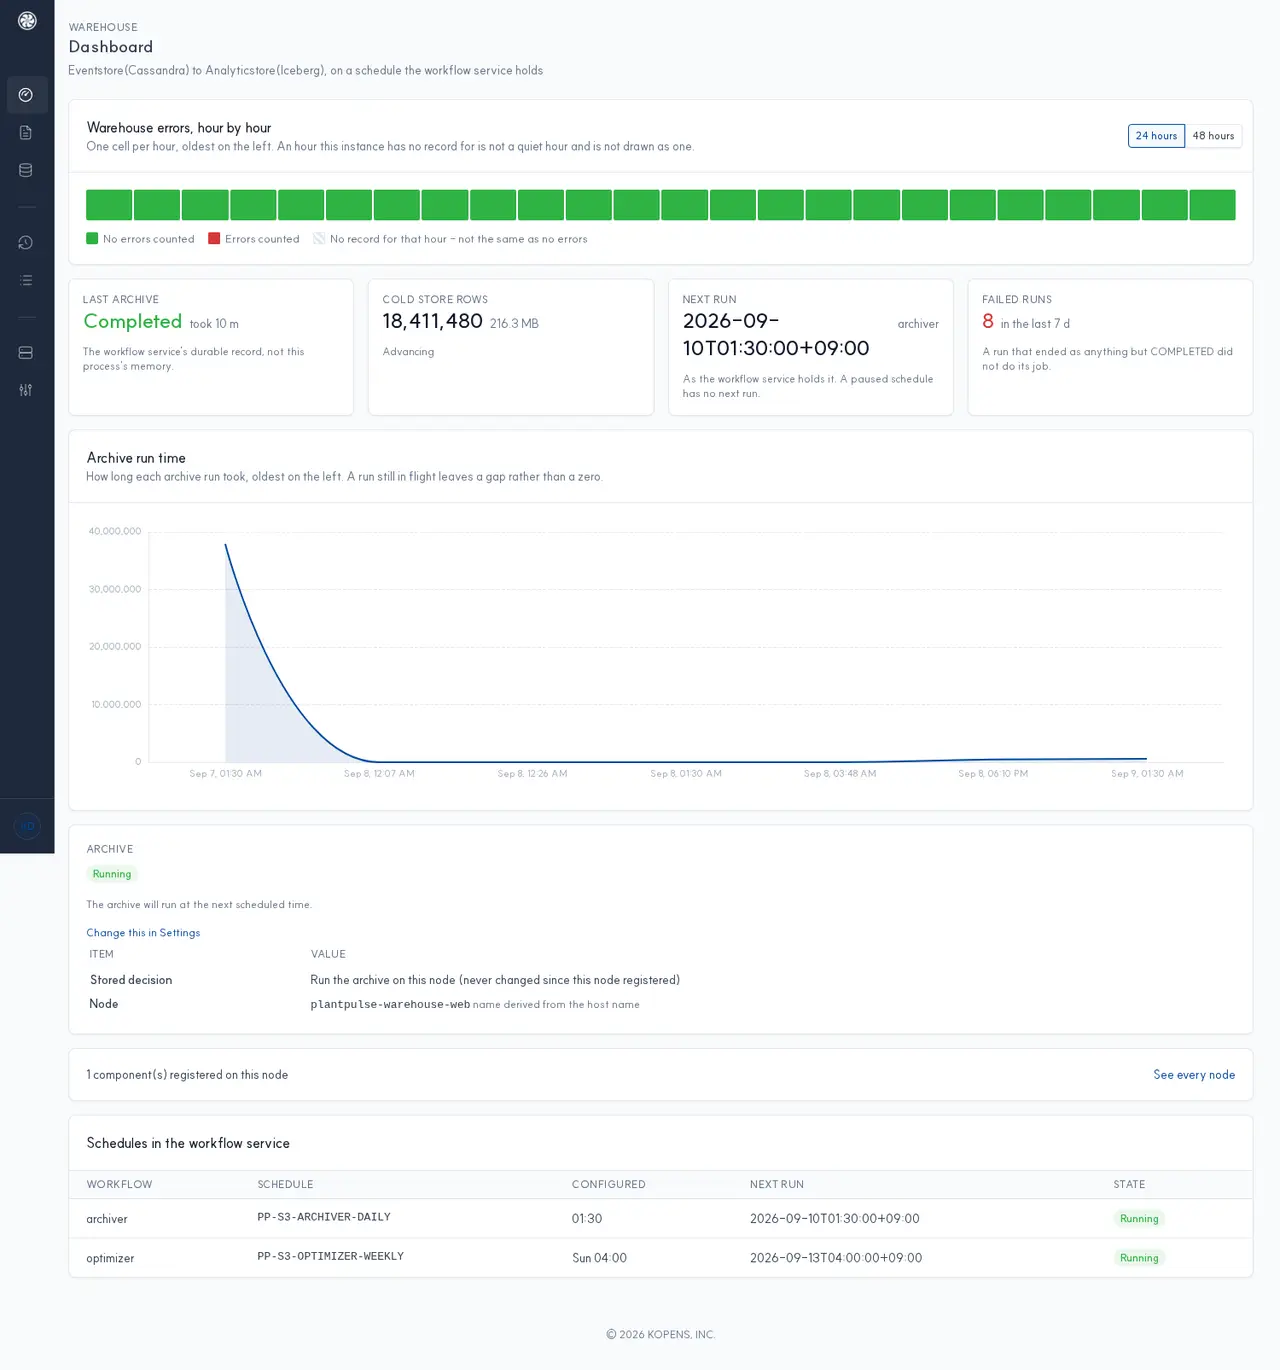
| What you see | What it means |
|---|---|
| Last archive | A record left in the workflow service — it does not disappear if you restart this process |
| Cold store rows | The number of rows and size accumulated in the cold tier (Iceberg) |
| Next run | The workflow service holds the schedule. A paused schedule has no next run. |
| Failed runs | Runs that ended in something other than COMPLETED. That means it did not do its job. |
| Archive run time | How long each run took. If one is still running, this is left blank, not 0. |
At the bottom, the schedules registered in the Schedules in the workflow service
table are listed as they are — e.g., archiver (daily at 01:30) · optimizer (Sunday 04:00).
Job Runs
What actually ran and how it ended. Scheduled runs and those you start manually from the console appear on the same lines — ones initiated from the console also go through the schedule, so the workflow service records them exactly like the nightly runs.
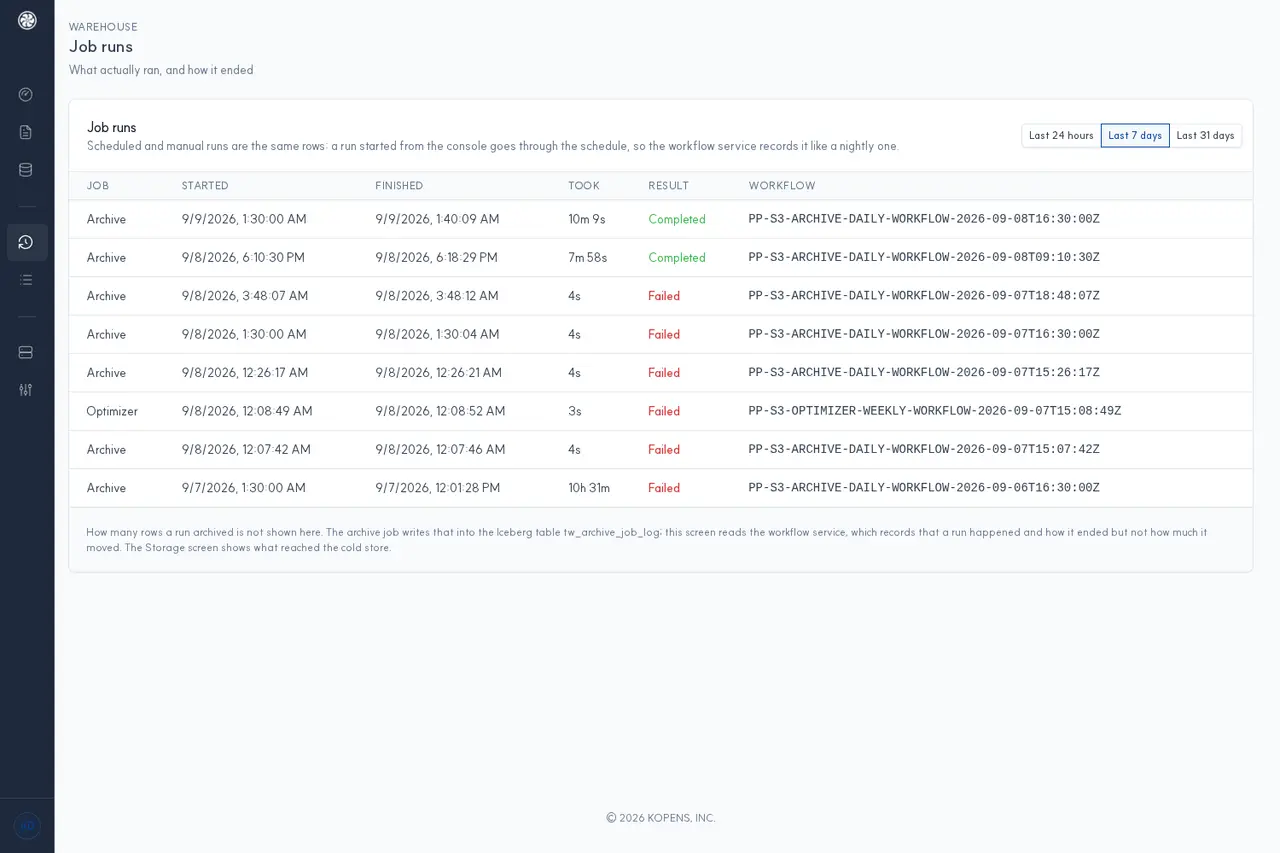
The archive job writes that number to the Iceberg table tw_archive_job_log. This screen reads the
workflow service, so it only knows «it ran · it ended this way.» For the amount moved,
see the Storage screen.
Storage
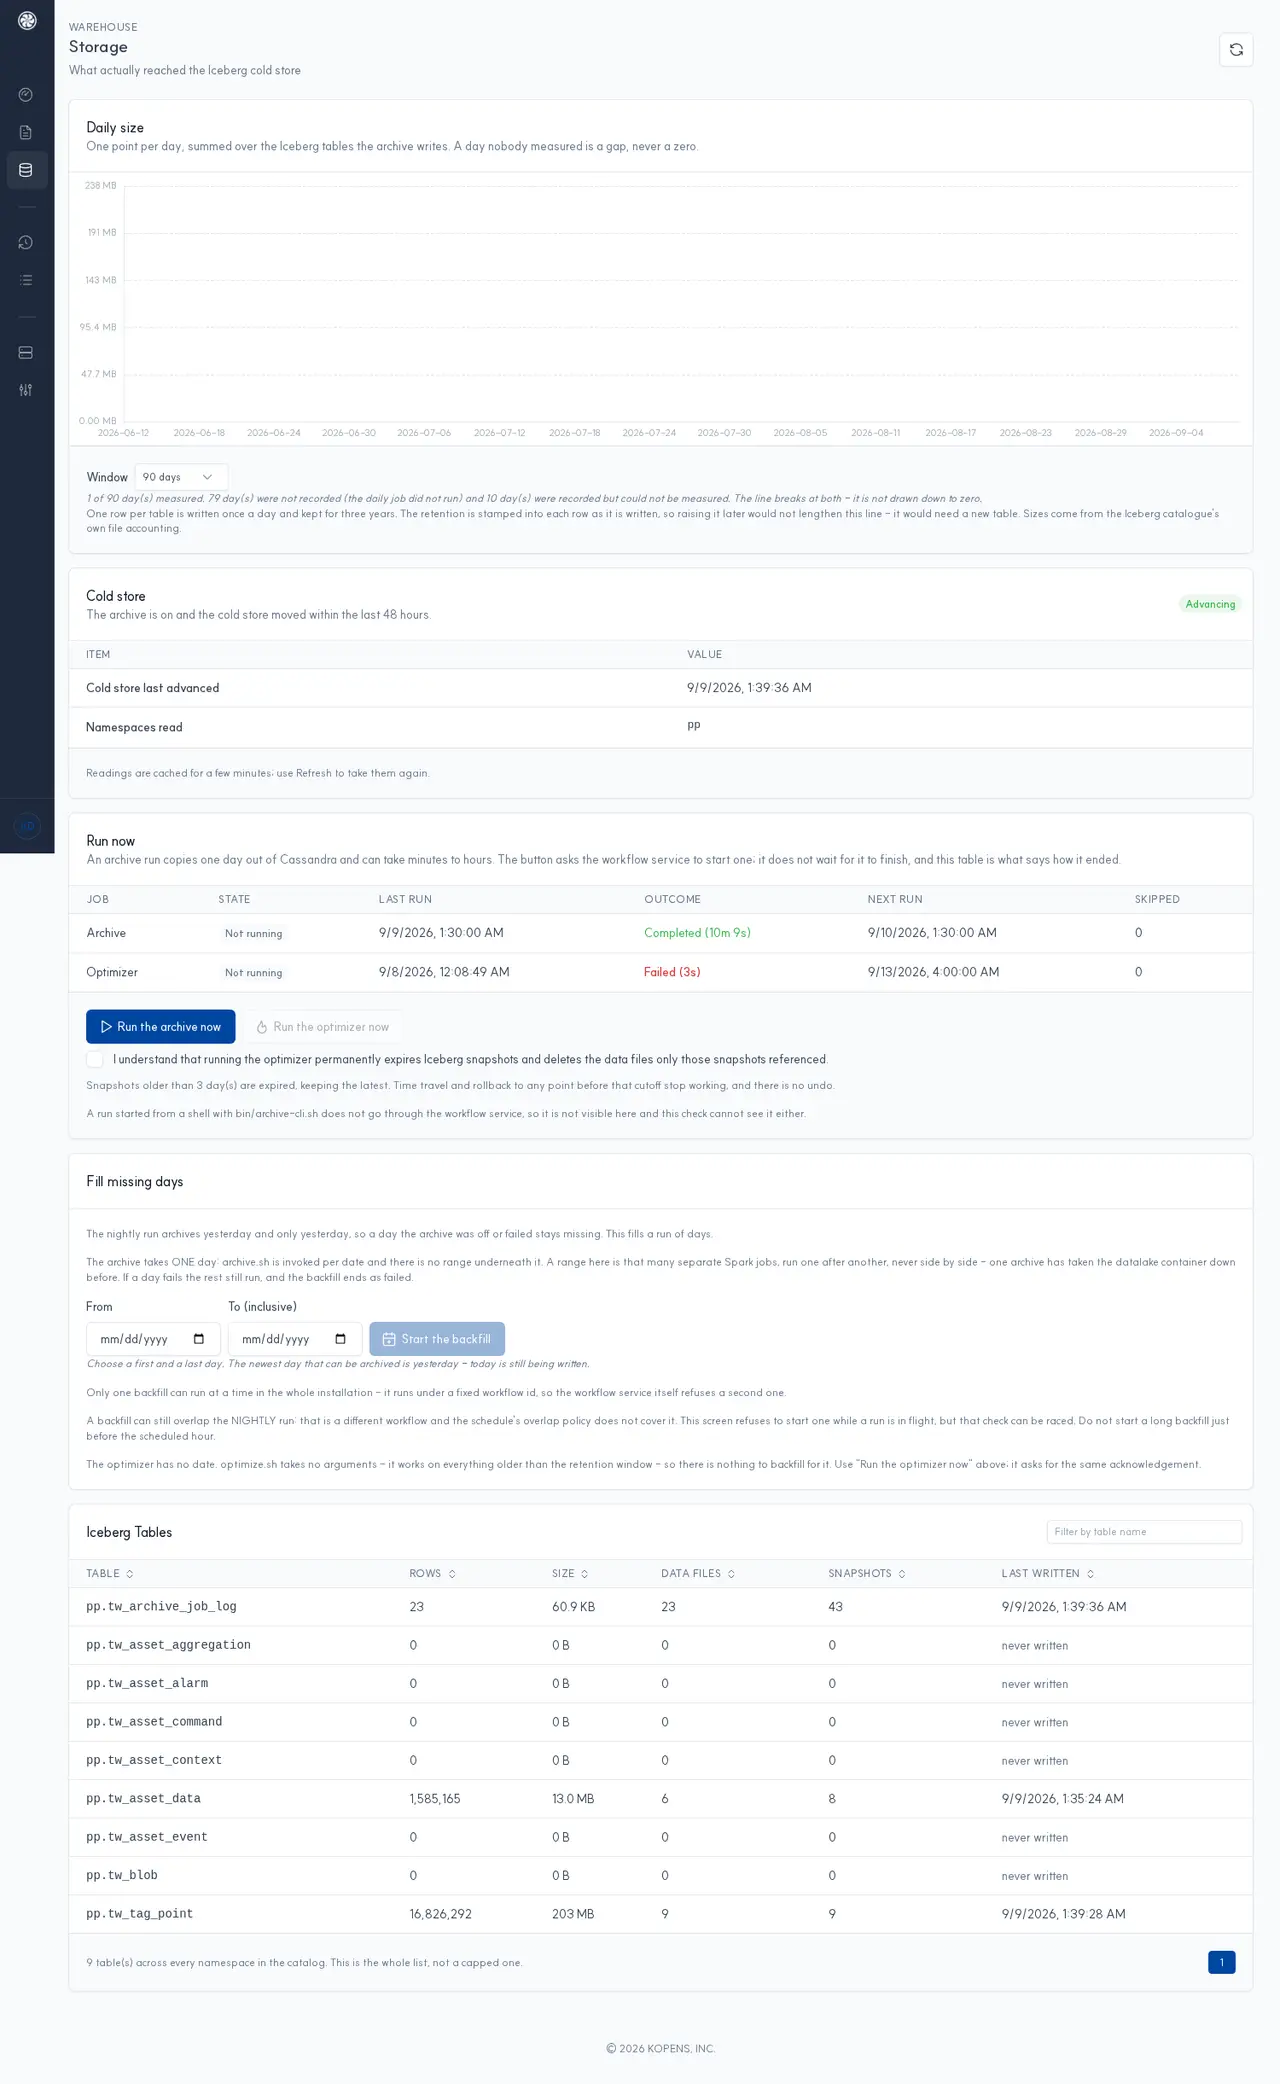
See what is in the cold tier and how much of it there is.
Logs · Audit Log
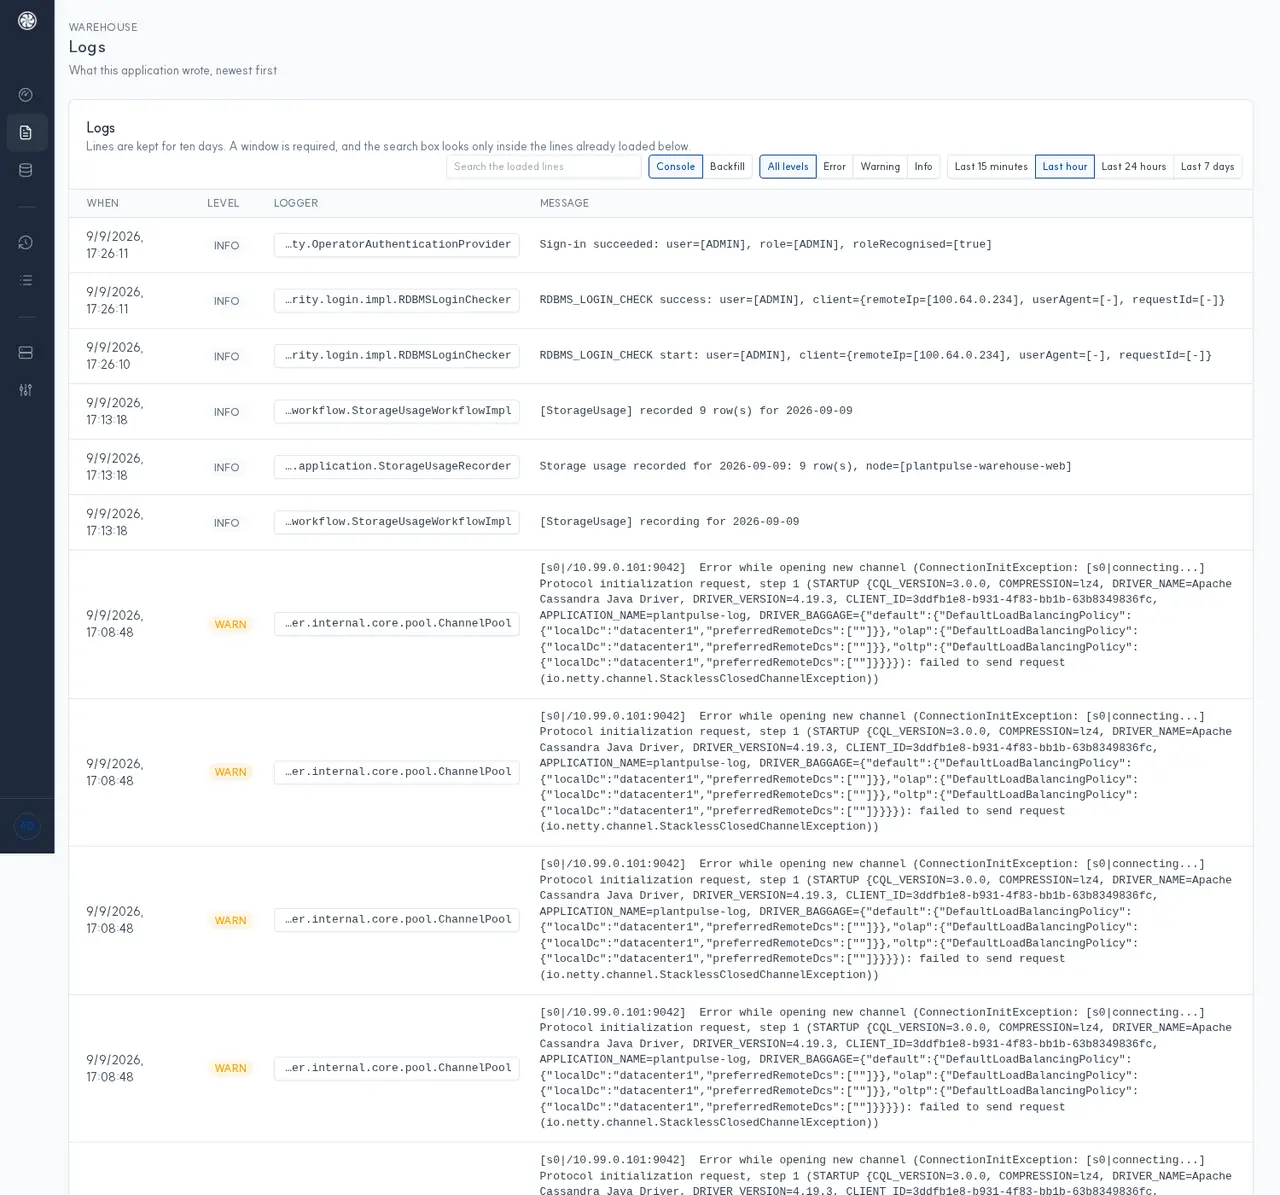
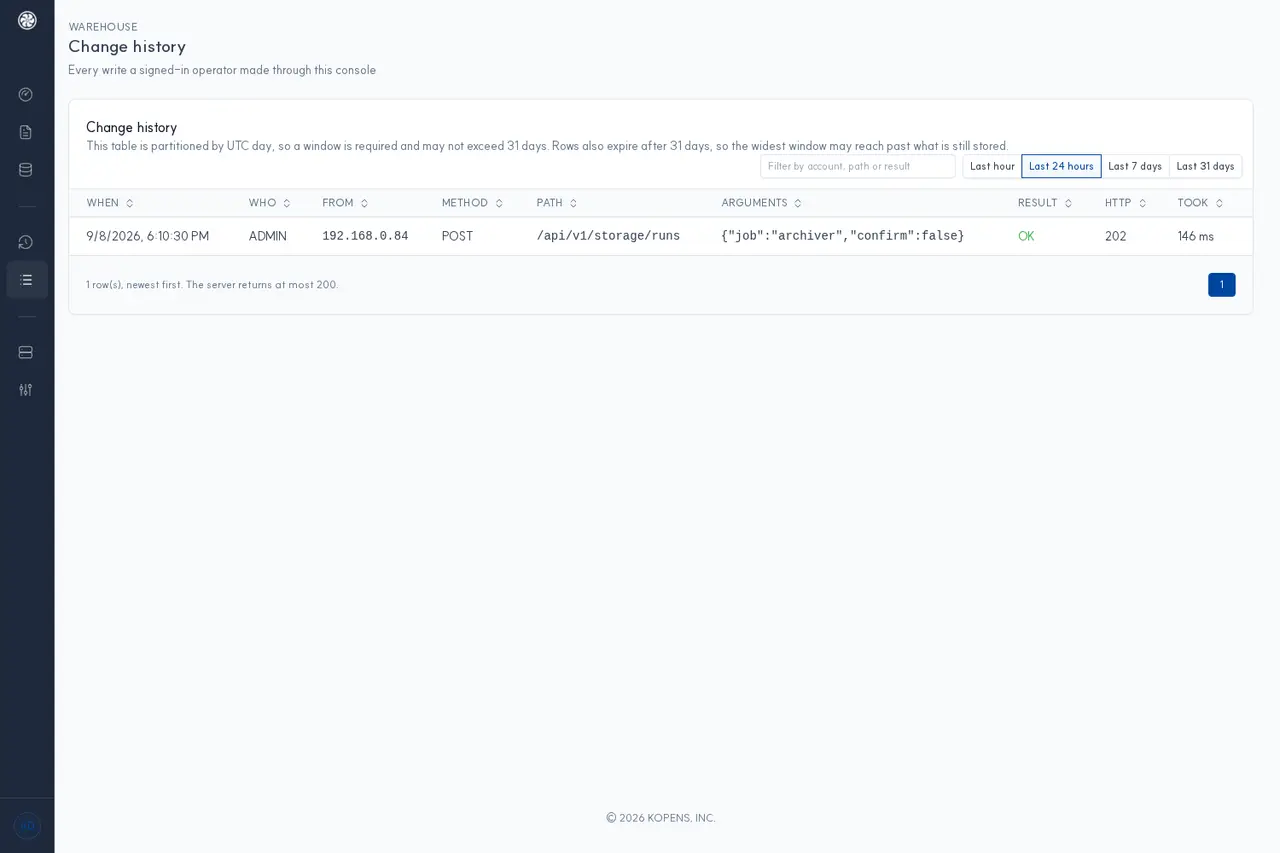
Logs are viewable directly in the browser, and changes made in the console are recorded along with the account.
Nodes
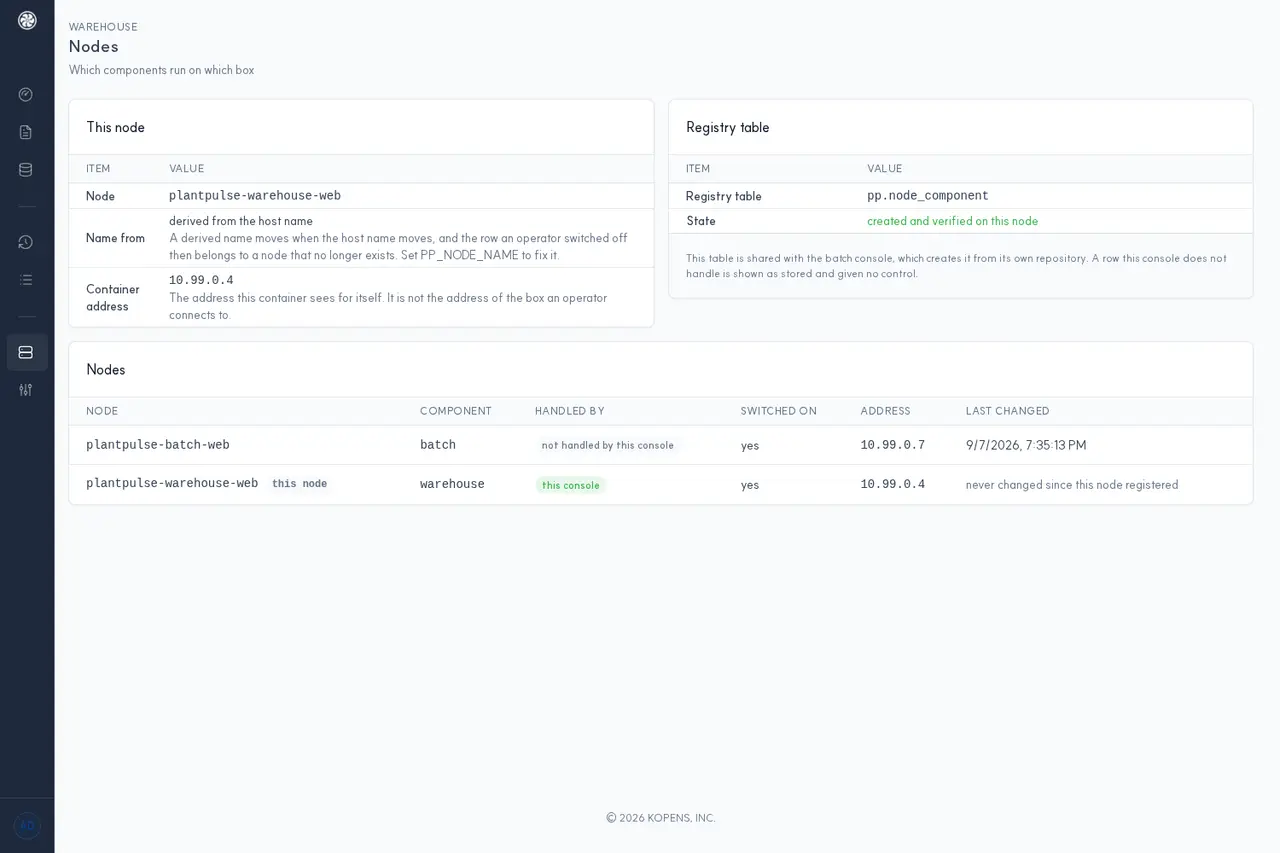
See which machine each component of this stack is registered to. It reads the same
registry (pp.node_component) as the equivalent screen in the Batch Console, so the Batch and
Warehouse views show each other.
Settings
Define what this deployment was started with, and whether to run the archive on this node. The only thing you can change on this page is that toggle.
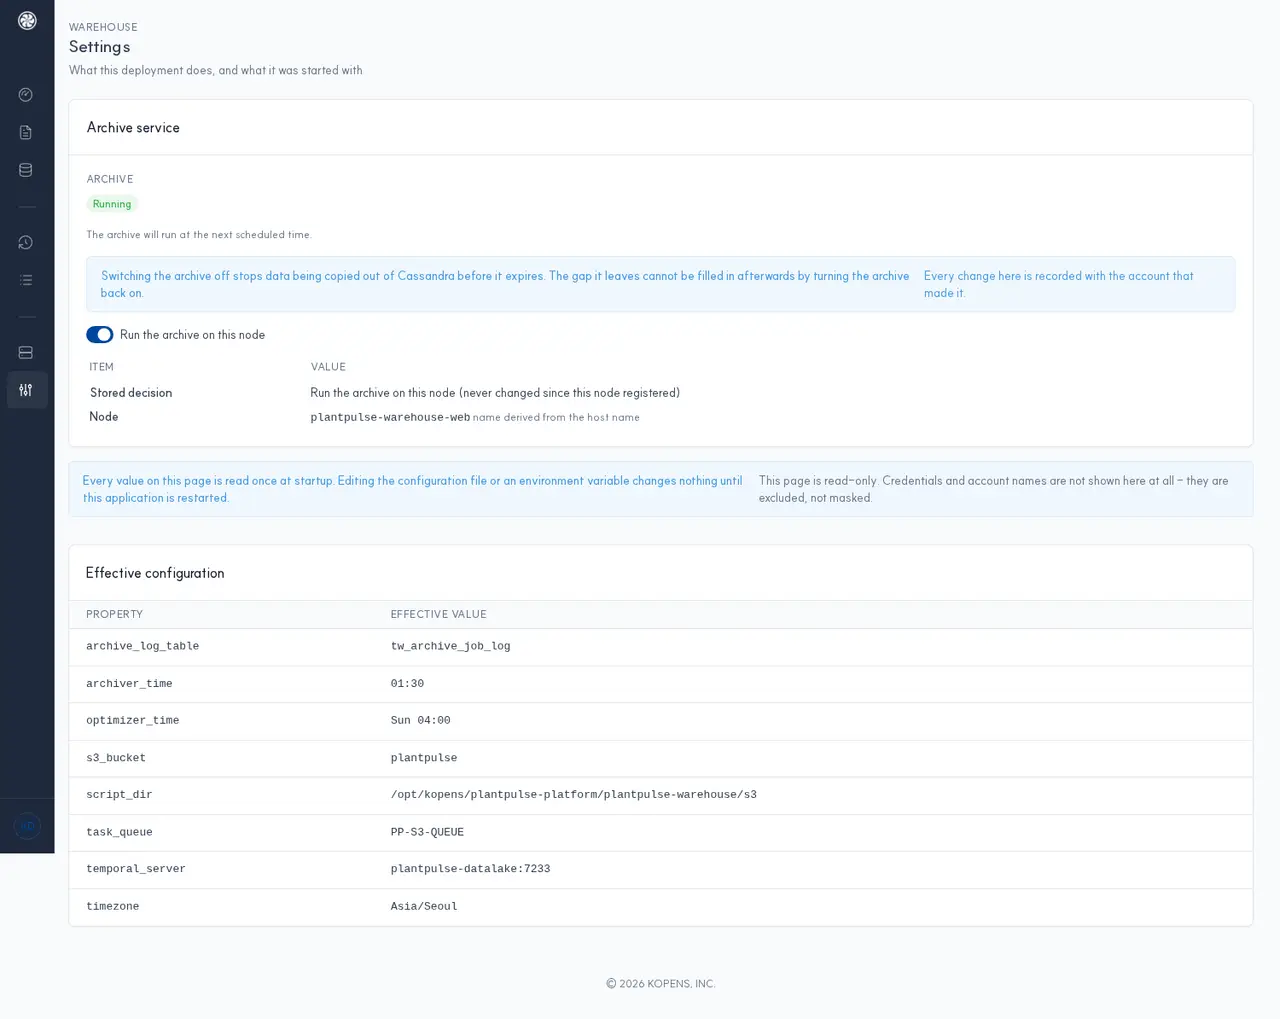
Turning off the archive stops the data in Aster TSDB from being copied before it expires. Any gap created that way will not be filled if you turn it back on later. All changes here are recorded with the account that made them.
The active configuration table shows values such as archiver_time (01:30) · optimizer_time (Sun 04:00)
s3_bucket · temporal_server · timezone as they are. The values are read once at startup, so
changing a file or environment variable will not take effect until you restart.
Credentials are not masked — they are excluded from the list entirely.
See Also
Batch Console (9501) Data Lake Management Console Data Lifecycle