Time Series Analyzer (7801)
This is a tool for plotting the metrics held by the Time Series Engine (TSE). Metrics for the platform, edge, JVM, and the engine itself are gathered in a single tree, where you can select them, overlay them, and switch to a table or TQL view.
| Item | Value |
|---|---|
| Address (TLS) | https://<server-ip>:7801/ |
| Login | Time Series Engine account |
| Other access path | Management Console → Tools screen, Timeseries Engine card |
For building field screens, use Canvas or PlantPulse Dashboard. This tool is for digging into what is happening right now — when a value spiked, or whether two metrics move together.
Screen
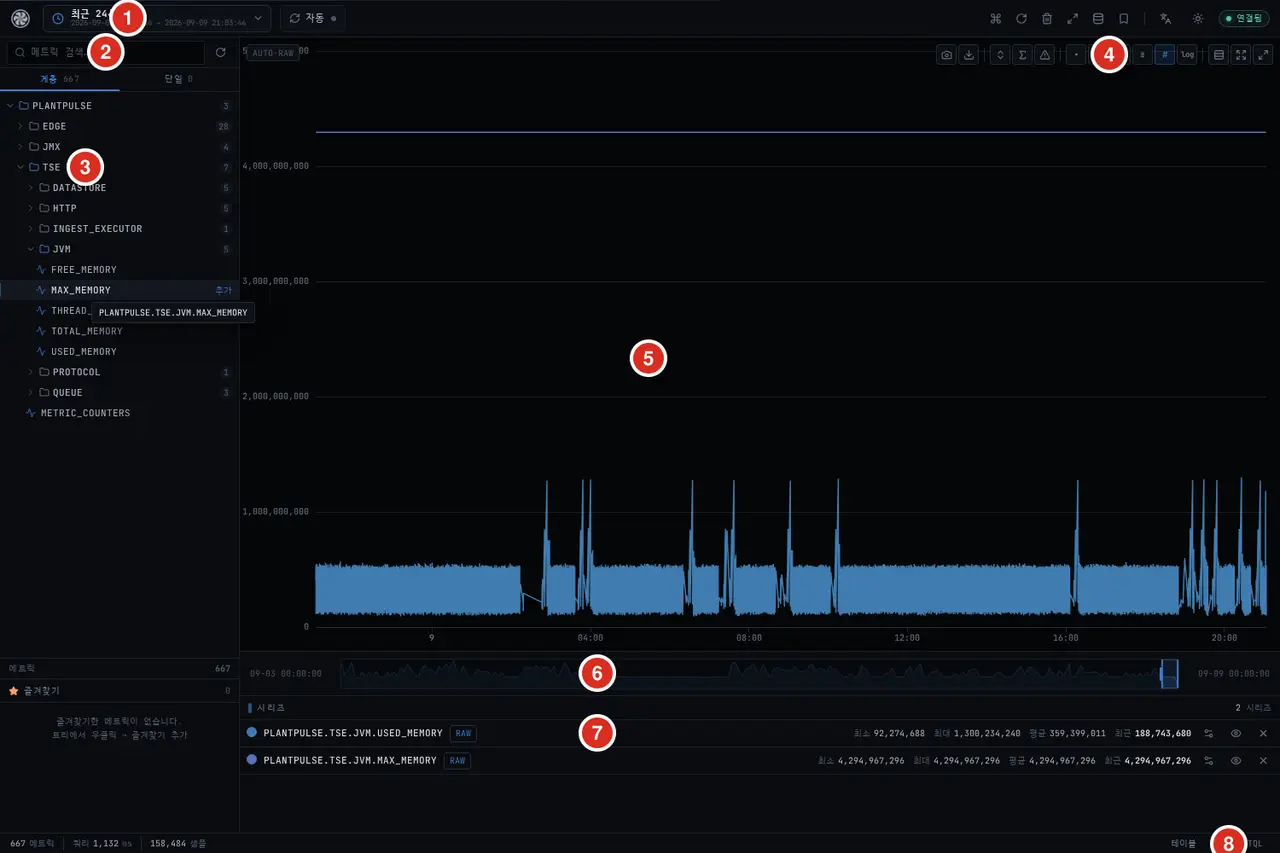
| No. | What |
|---|---|
| ① | Time Range — presets like "Last 24 hours" and direct specification. The "Auto" option next to it enables periodic refresh |
| ② | Metric Search — search by name among 667 metrics |
| ③ | Metric Tree — PLANTPULSE followed by EDGE · JMX · TSE. Clicking a leaf adds it to the chart (does not replace the current view) |
| ④ | Chart Tools — save image · download · align axes · summarize · threshold lines · point/line · log axis · fullscreen |
| ⑤ | Chart — view overlaid series together |
| ⑥ | Time Brush — drag the lower band to narrow the interval. The chart above follows |
| ⑦ | Series List — for each series: minimum · maximum · average · most recent. Use the eye icon to temporarily hide, × to remove |
| ⑧ | View Switcher — 테이블 · JSON · TQL. The bottom left shows the metric count, query time, and sample count |
How to Read the Tree
| Branch | Contents |
|---|---|
EDGE | Metrics sent by edge gateways |
JMX | JVM process metrics |
TSE | Engine itself — DATASTORE · HTTP · INGEST_EXECUTOR · JVM · PROTOCOL · QUEUE · METRIC_COUNTERS |
The fully qualified metric name is the branch path concatenated — e.g., PLANTPULSE.TSE.JVM.USED_MEMORY.
Since that name appears verbatim in the series list, you can copy it from here to use in TQL or PlantPulse Dashboard.
Looking at USED_MEMORY alone, you can't tell if the sawtooth is normal. Adding MAX_MEMORY shows at a glance "how close to the ceiling" it is. The screen above is an example of that.
Table · JSON · TQL
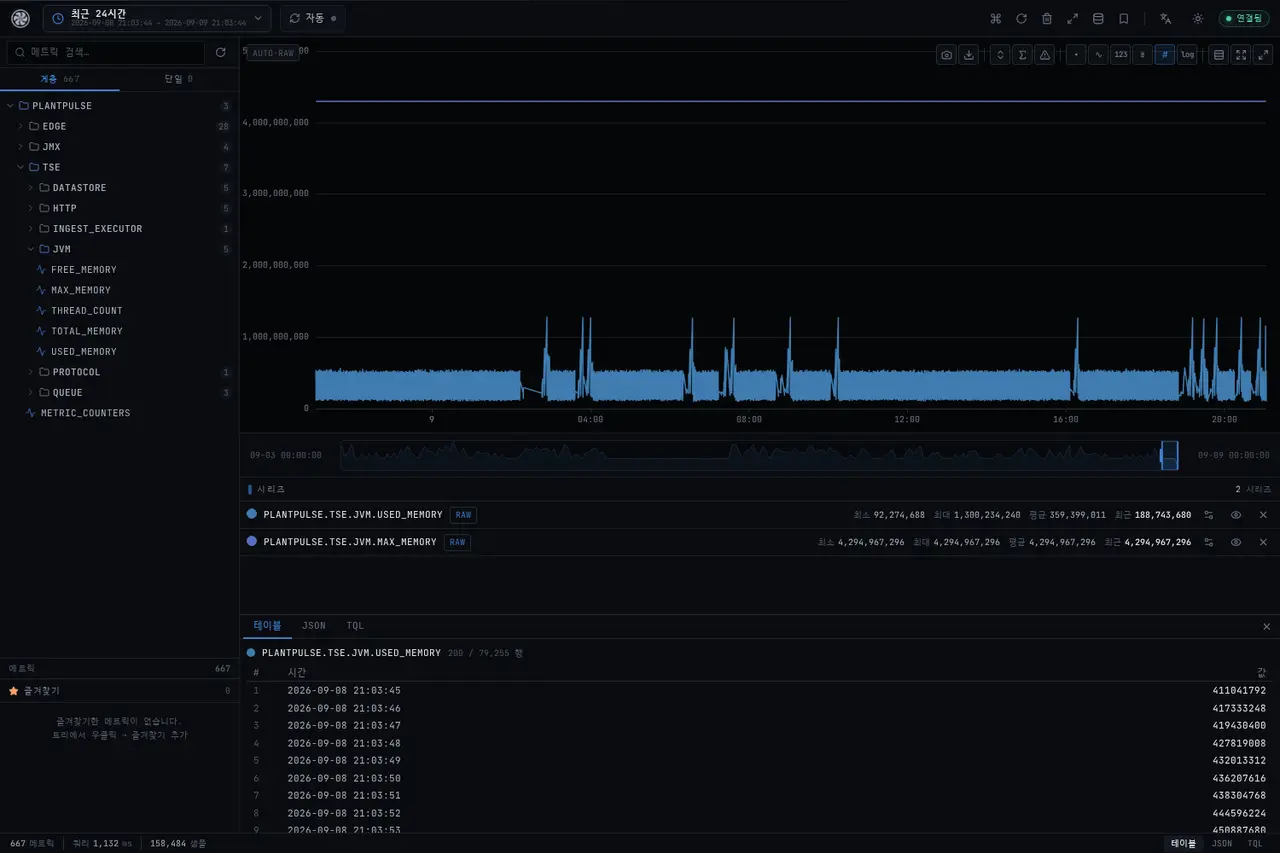
Table — view the plotted data as values. Use this when you need to confirm exactly when a point occurred.
TQL — shows the query behind the current screen. Copy it as-is for use in Data Gateway Console TQL mode or in a program.
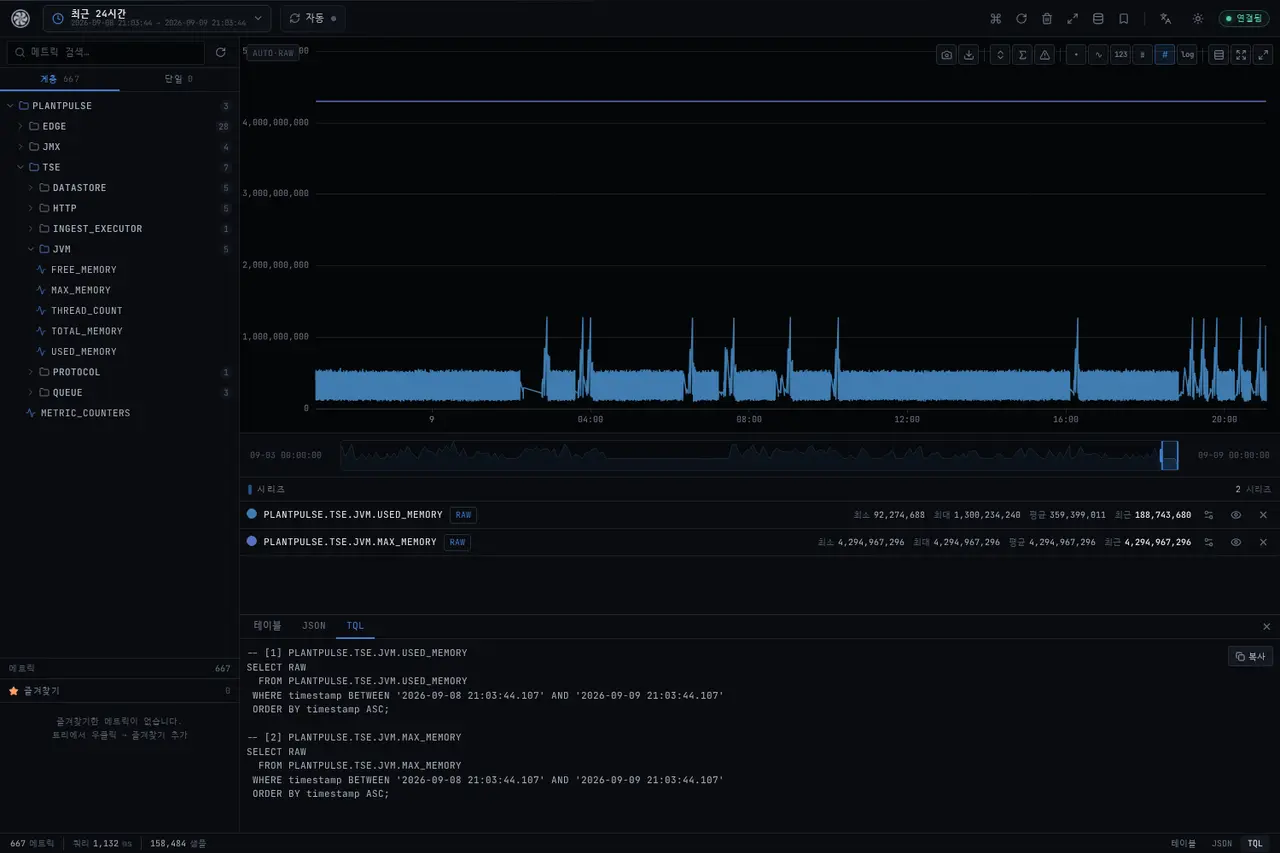
A query you construct by clicking is immediately a TQL statement. It's faster to build here and copy it out than to learn the syntax by hand.
When It's Slow
First check the query time and sample count at the bottom left. The screen above read 158,484 samples in 1,132 ms. If it's slow, it's usually one of these two.
| Symptom | Where to look |
|---|---|
| Sample count exceeds hundreds of thousands | Narrow the time range or cut the interval with the brush |
| Many series overlaid | Remove the ones you're not looking at with × — hiding (eye icon) does not reduce the query |
See Also
Data Gateway Console (5501) · timeseries component · System Monitoring