Field User Guide
This guide explains how to log in from a tablet next to equipment, monitor status, record downtime reasons and defects, request maintenance, manage work orders, and generate reports. Tablet registration is handled by the administrator in the app, and worker accounts are first created by the administrator in the «Employees» section of the Platform console (Installation and Administration).
Login
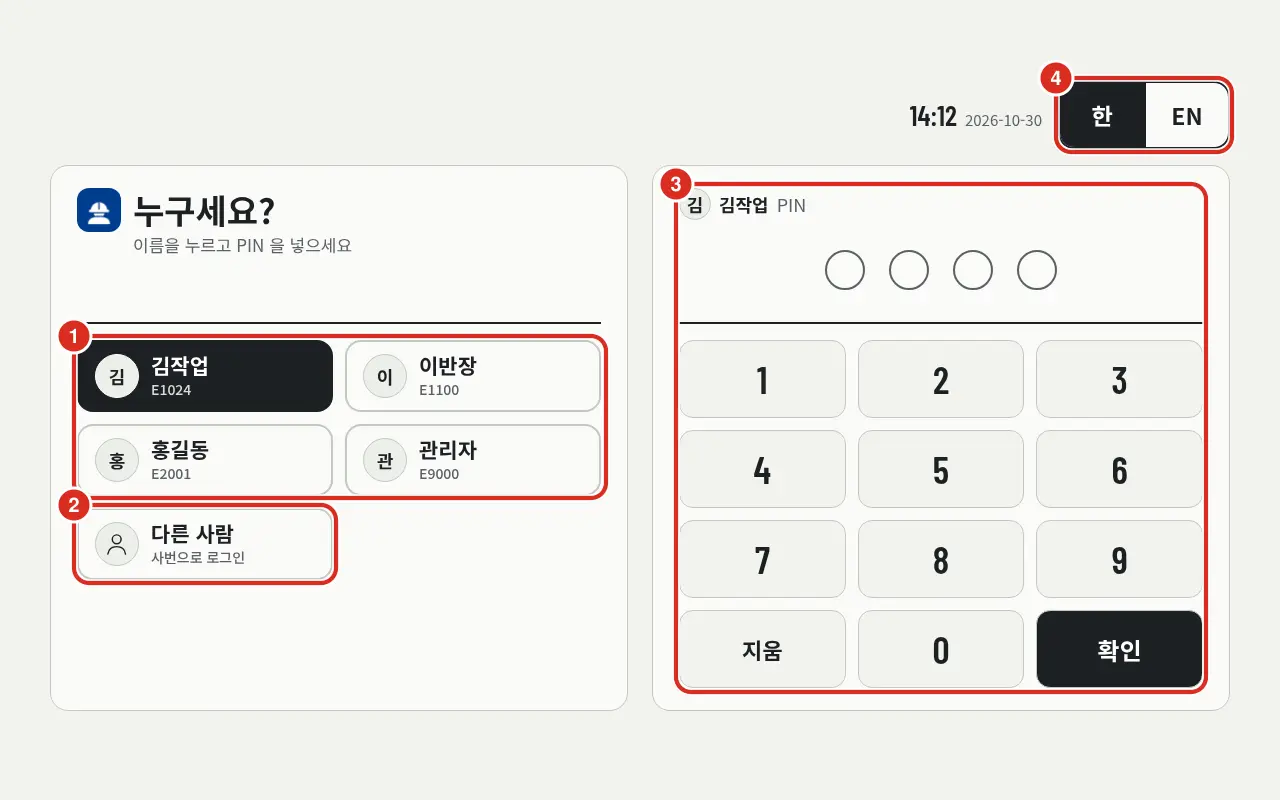
| Number | Location | Function |
|---|---|---|
| ① | Recent Users | Names and employee IDs of people who recently logged in on this tablet (up to 8 users). Tapping a name allows entry via PIN — «Select name and enter PIN» |
| ② | Others | «Login with Employee ID». For first-time use on a tablet, tap this and follow «Enter Employee ID and PIN» |
| ③ | PIN Pad | The name of the selected user and «PIN». The PIN is a 4–6 digit number. Clear deletes one digit, and Confirm proceeds to login |
| ④ | Kor | EN | Changes the language of the pre-login screen. The current time and date are displayed on the left |
- Employee IDs (login numbers) and PINs are unique to each person and consistent across all tablets. Accounts are managed on the Platform.
- PINs can be entered using the on-screen pad or an attached keyboard. Number keys enter digits, Backspace deletes one digit, Enter acts as Confirm, and Esc clears all entered digits. The PIN field does not need to be tapped separately, and the tablet's soft keyboard will not appear.
- The screen language can be changed using the Kor | EN button (④) at the top right of the pre-login screen. This affects only that screen; after login, the language reverts to the user's specific setting (Screen Language and Themes).
- If it is the first login or the administrator has reset the PIN, the Set New PIN screen appears first. A new PIN must be set to access other screens.
- If the PIN is entered incorrectly 5 times, the account is locked for 5 minutes. Wait or request an administrator to unlock it via the Platform console. If entered incorrectly 20 times on a single tablet, that tablet is locked for 15 minutes.
- Users who have resigned or are on leave cannot log in even with the correct PIN.
- Login is possible even if the Platform is down — the system verifies against accounts cached on the tablet server and displays «Unable to reach Platform; logged in using cached account on tablet». However, if the cache is too old (default 7 days), login is denied (Login during Platform Downtime).
- Users are automatically logged out after a period of inactivity (default 15 minutes). This duration is configured by the administrator in Kiosk.
- Upon logout, the current screen is cleared. The next user starts from their own home screen.
My Profile — Screen Language · Theme · PIN
After logging in, tap your name at the bottom of the left menu to open «My Profile». Here, users can select their screen language and theme, change their PIN, and log out.
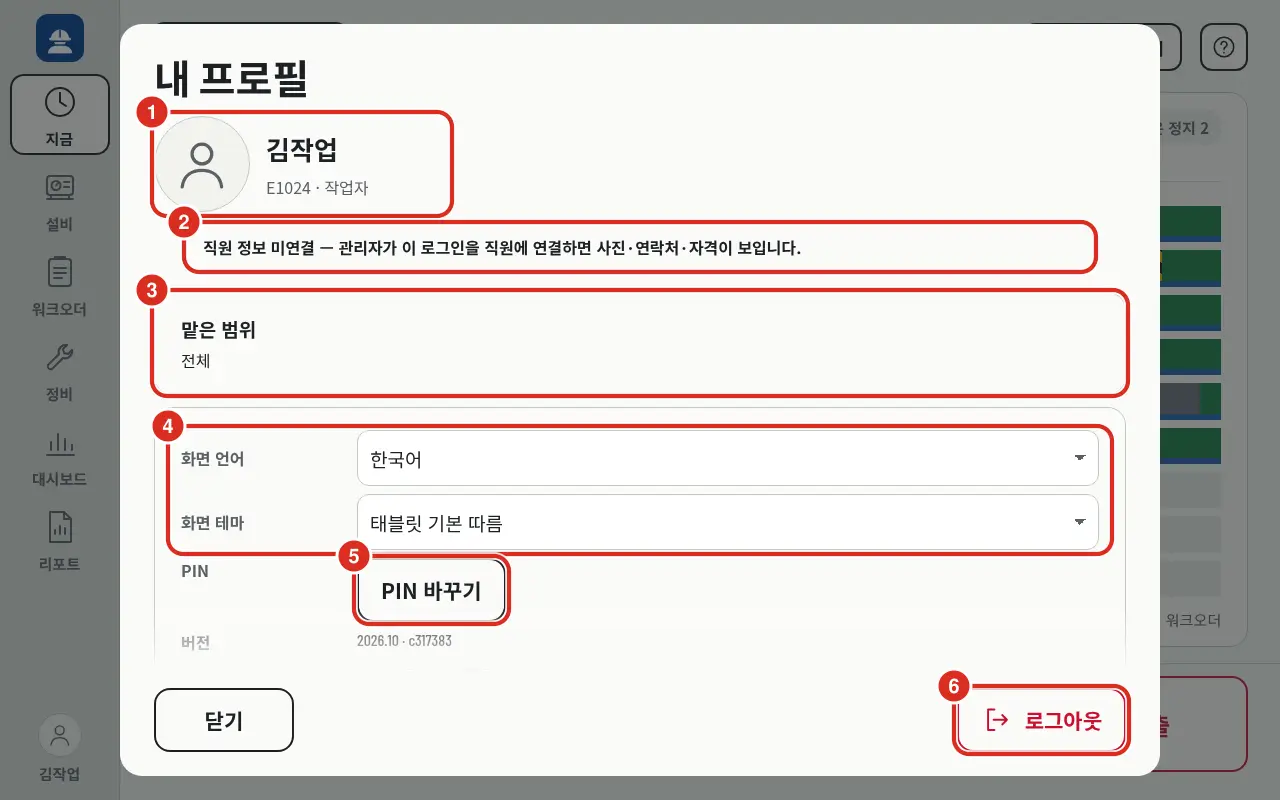
| Number | Location | Function |
|---|---|---|
| ① | Name | Name, employee ID, and role (e.g., «E1024 · Worker») |
| ② | Employee Info | If login is not linked to a Platform employee, «Employee info not linked — Link this login to an employee in the admin console to see photos, contacts, and qualifications». If linked, affiliation, contact, qualification, and skill are displayed; the user can change their photo and contact info |
| ③ | Assigned Scope | The scope granted to the user. Either «All» or «Work» / «View» per assigned equipment or line |
| ④ | Screen Language · Screen Theme | Language: «Default — Follow device/installation language», Korean, English. Theme: «Follow tablet default», Light, Dark |
| ⑤ | Change PIN | Opens the screen to change the user's PIN — see image below |
| ⑥ | Logout | Asks «Log out?» once before logging out. Close only closes the profile |
- Selected language and theme are stored in the Platform account. These settings apply regardless of the tablet used and revert to tablet defaults upon logout.
- Both can be changed only when connected to the Platform. The fields are disabled during a connection loss.
- Scrolling down reveals «Version» (app version) and «This Device» (tablet name and screen size).
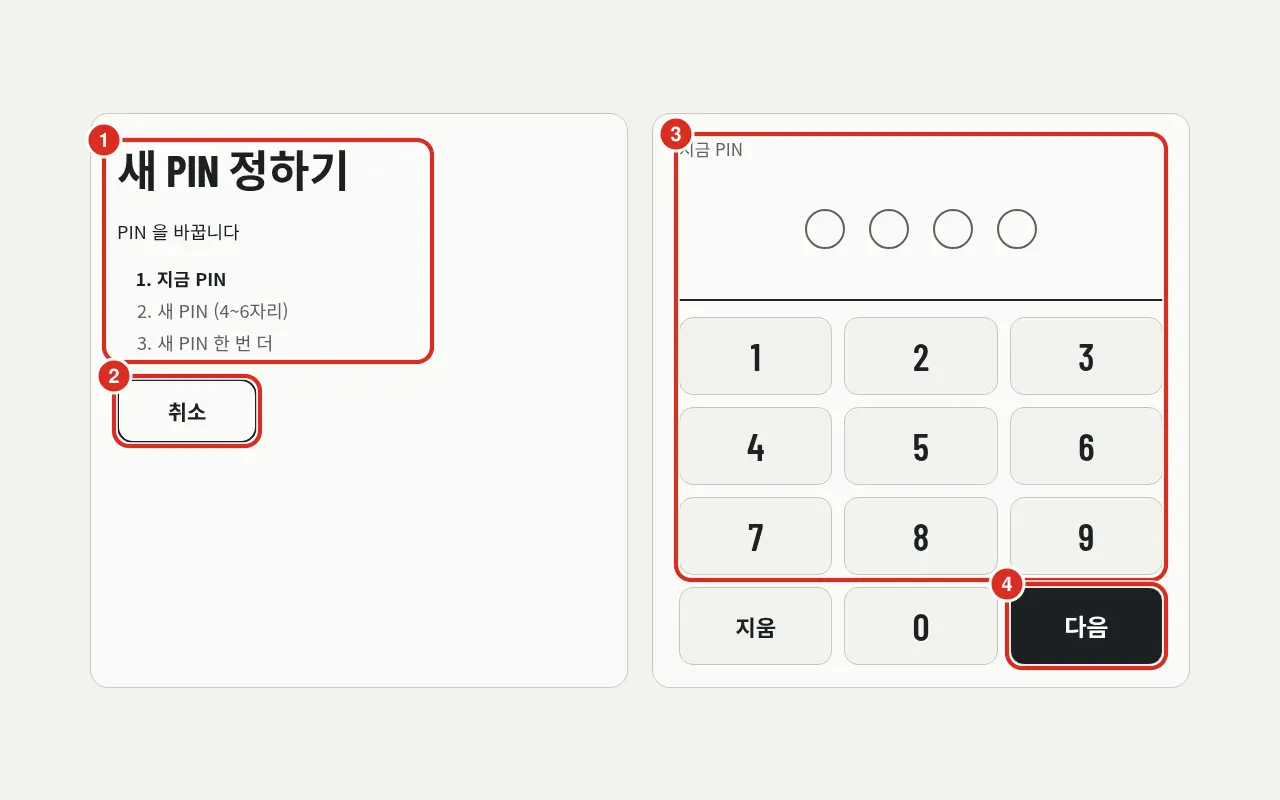
| Number | Location | Function |
|---|---|---|
| ① | Step | «Set New PIN», «Change PIN». The current entry step among «1. Current PIN», «2. New PIN (4–6 digits)», and «3. Confirm New PIN» is highlighted |
| ② | Cancel | Returns without changing |
| ③ | PIN Pad | Displays the current step («Current PIN») and the number of digits entered |
| ④ | Next | Proceeds to the next step |
- Change PIN and initial PIN setup (after first login or PIN reset) require a Platform connection. The button is disabled if disconnected.
- After first login or PIN reset, the screen opens with «First login or PIN reset. A new PIN must be set to access other screens». Tapping Cancel at this stage results in logout.
- The new PIN must differ from the current PIN («Set a PIN different from the current PIN»). If the current PIN is wrong, «Current PIN is incorrect» appears; if the two new PIN entries differ, «The two PIN entries do not match» appears. Upon success, «PIN has been changed» is displayed.
Visible Scope After Login
Every user has an Assigned Scope determined by the administrator, and every tablet has a Default Scope determined by the administrator (Assigned Scope, Device Management). Upon login, the screen displays the intersection of the two, meaning only equipment or lines within the tablet's scope that are also part of the user's assigned scope are visible.
- The tablet scope only narrows the visible area. If the assigned scope is broader than the tablet scope, only the tablet scope is shown. If the assigned scope is narrower, it is shown as is. If the assigned scope is «View», it remains «View» on the tablet.
- Users with the Administrator role see everything on any tablet. Tablets without a default scope do not narrow the view.
- If the tablet's default scope does not overlap with the user's visible area (e.g., a line tablet for a user who is only assigned one specific piece of equipment), the screen automatically moves to the first assigned piece of equipment or line for that user.
- Equipment assigned as «View» only can be monitored. A «View Only» label is added to the header, and input buttons are disabled (View-Only Equipment).
- Users with no overlapping scope or no assigned scope will see the following screen.
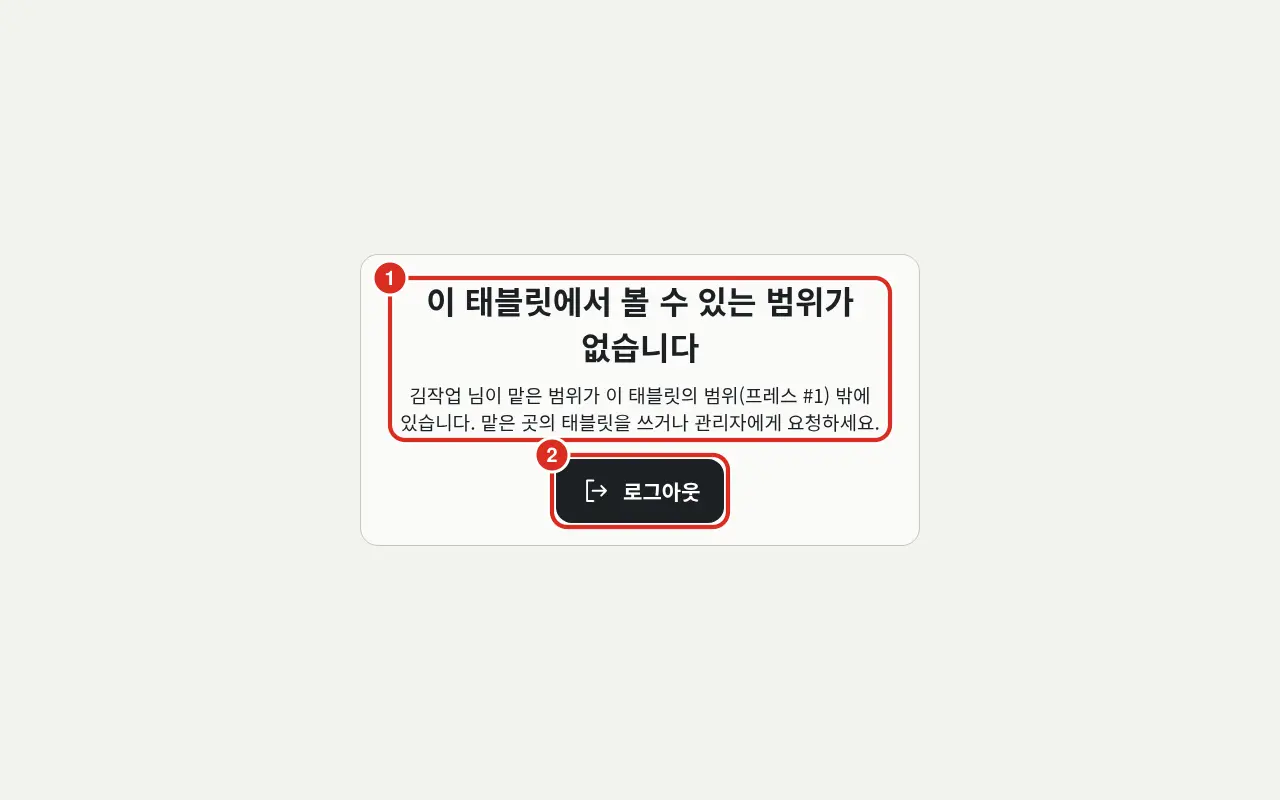
| Number | Location | Function |
|---|---|---|
| ① | Title · Notice | If no overlap: «No visible scope on this tablet» — «The scope assigned to [User Name] is outside the scope of this tablet ([Equipment Name]). Please use the tablet for your assigned area or contact the administrator». If no scope is assigned: «Scope Not Assigned» — «[User Name] has no assigned equipment. Please request equipment assignment from the administrator». |
| ② | Logout | Logout is the only available action on this screen |
No menus, cards, or buttons are available. The user must use the tablet in their assigned area or log in again after receiving a scope assignment.
Now — Equipment Screen
This is the initial screen for a tablet linked to a single piece of equipment.
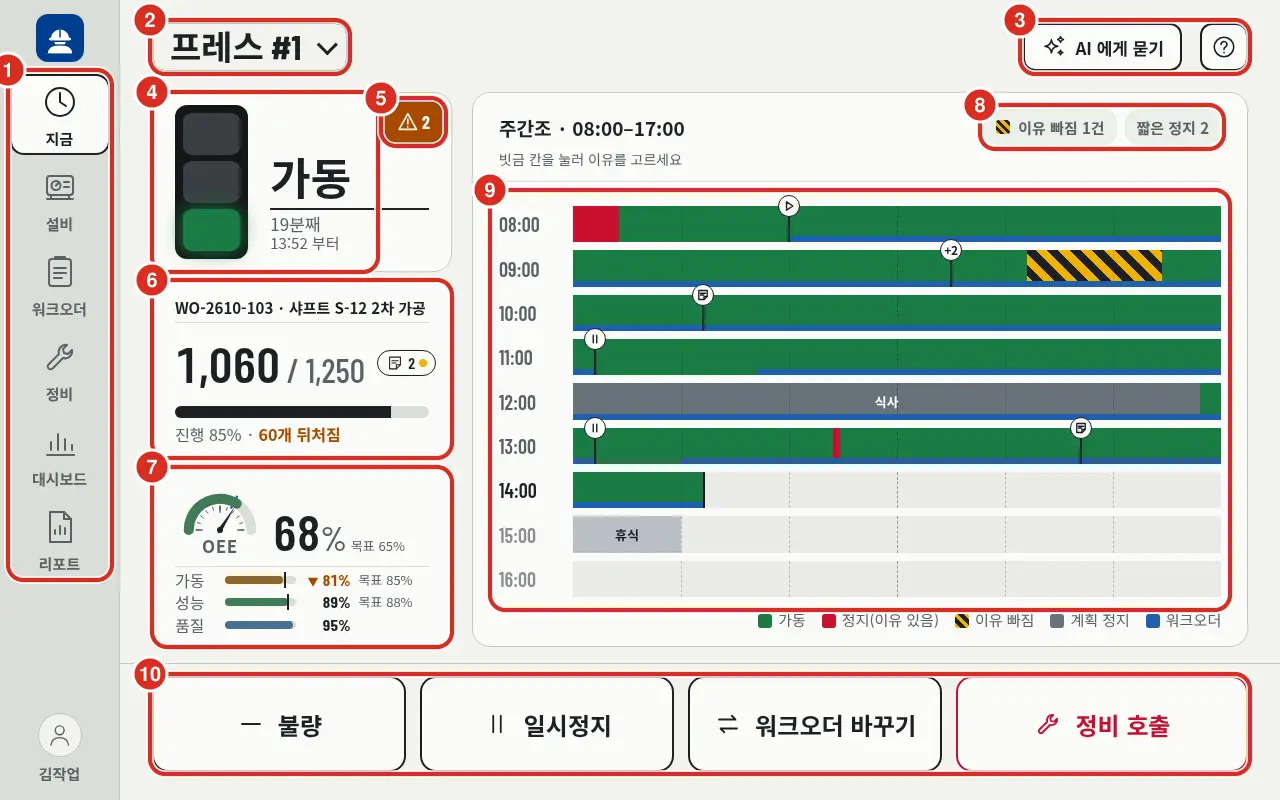
| Number | Location | Function |
|---|---|---|
| ① | Left Menu | Now · Equipment · Work Order · Maintenance · Dashboard · Report. The number next to «Equipment» is the count of active alarms for the current equipment (or line equipment); the number next to «Maintenance» is the count of open maintenance calls. Tapping the name at the bottom opens My Profile |
| ② | Scope Selection | Switch to other equipment or lines. Selection sequence: Site → Line → Equipment |
| ③ | Ask AI · ? | Ask AI (only when AI is linked) and ? which opens this manual in a new tab — Ask AI |
| ④ | Status | Beacon color and status (Running · Stop · Failure · Idle · Setup · Planned Stop), duration of the current status (e.g., «19 min», «1 hr 5 min»), start time (e.g., «Since 13:52»), and signals sent by equipment. Tapping opens «Today's Status History» |
| ⑤ | Alarm | Displays the icon of the highest grade and the number of active alarms if any — Alarm |
| ⑥ | Active Work Order | Number and name of the current work order, «Good / Planned» with a progress bar, and progress rate vs standard (e.g., «Progress 85% · 60 behind»). If no standard exists: «Progress 85% · Std Cycle 14.0s». The chip at the top right indicates the number of notes for this order. Tapping opens order details; if no order is active, tapping selects an order. Time-Based Orders show completion rate and «Running X / Std Y» instead of a progress bar |
| ⑦ | Work Order OEE | OEE of the active (or paused) work order — semi-circle gauge with large %, and Running · Performance · Quality bars below. If a target exists, «Target 65%» is displayed, and colors are determined relative to the target — see OEE Gauge Colors. Tapping opens «Work Order OEE 68% — Where was the loss?» |
| ⑧ | Chips | «Missing Reason N» (Missing Reason and Quantity Correction) and «Short Stop N» (Short Stop). Tapping opens the list |
| ⑨ | Timeline | Rows stack by hour. Green is Running, Red is Stop with reason, Yellow hatched is Stop without reason, Gray is Planned Stop (type name like «Meal» · «Break»), and Blue band indicates work order duration. Tapping hatched areas allows reason selection. Markers for lines and icons indicate work order Start · Pause · End, Maintenance Call, and Note timestamps; tapping reveals the event. Clustered markers are grouped (e.g., «+2») |
| ⑩ | Action Buttons | From left: Defect · Pause / Resume (when active/paused work order exists) · Completion Rate (for time-based orders) · Change Work Order · Maintenance Call |
- If an open maintenance call exists for this equipment, a call status bar appears at the top of the screen — Maintenance Call.
- Timeline titles show shift and window if a schedule exists (e.g., «Shift A · 06:00–14:00»); otherwise, they show time and window (e.g., «Last 9 Hours · 07:00–16:00»). Only one notice is displayed below: «Tap hatched cells to select reason» if there are stops without reasons, or «Showing last 9 hours due to no shift schedule».
- Shift windows and the «Last 9 Hours» view are determined by the Platform, not the app. If no schedule exists, the «Viewing Time Window» can be toggled between 9 and 12 hours. For equipment without a schedule, administrators will see «Register shift schedule in console».
- Pause / Resume are one-tap actions without opening order details. «Pending Transmission» is displayed on the button if the input is awaiting transmission.
- Defect opens Defect Recording, Completion Rate opens Time-Based Orders, Change Work Order opens Select Order, and Maintenance Call opens Maintenance Call.
OEE Gauge Colors
The work order OEE gauge and Running · Performance · Quality bars in the «Now» screen are colored based on the Target.
- Targets are not set in the app. The Platform V5 provides the value entered in the «Reference Value» tab («OEE Target») of the «Asset» screen in the Platform console. This is the same target used in the console's equipment dashboard.
- Green if above target, Orange if within 5%p below target, and Red if lower. Bars below target are marked with «Below Target» (▼).
- If no target exists, colors are not used for judgment — the gauge remains a neutral color, and target markers or «Target N%» are not displayed.
- If no work order is active, «-» and «No active work order» are shown. If the Platform has not yet produced OEE, «Calculating» is shown. It is not drawn as 0.
If «Not Applied» appears in the status or OEE area, the corresponding Platform plugin is not applied to that equipment. This is not an app failure — Plugin FAQ.
View-Only Equipment
If equipment is assigned as «View» in the assigned scope, a «View Only» label is added to the header (tapping it displays «This equipment is view-only (Assigned Scope: View).»).
- Defect · Pause / Resume · Completion Rate · Change Work Order buttons are disabled. Tapping a disabled button displays «This scope is view-only».
- The stop reason window does not appear automatically, and the timeline header notice changes to «Hatched cells are stops without reasons · View Only».
- Maintenance Call remains enabled. This ensures anyone who observes an equipment problem can request maintenance.
Now — Line Screen
When the scope is set to a line, equipment within that line is displayed as cards only on a single screen. There are no top bands or bottom lists.
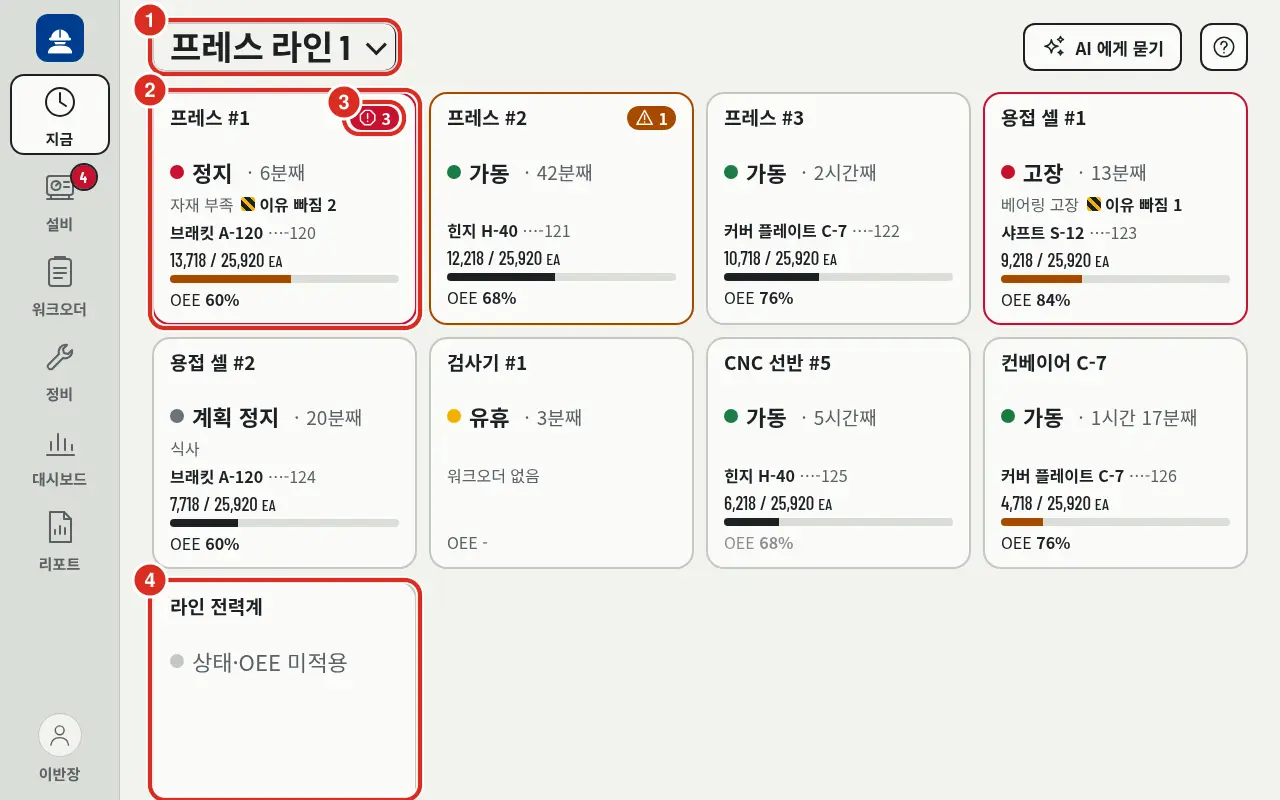
| Number | Location | Function |
|---|---|---|
| ① | Scope Selection | Line name. Switch to other lines or equipment |
| ② | Equipment Card | Equipment name, status and duration (e.g., «Stop · 6 min»), stop reason and «Missing Reason 2», active work order product and last digits of order number (e.g., «Bracket A-120 ····120»), «13,718 / 25,920 EA» and progress bar (color changes if behind standard; «No work order» if none), «OEE 60%». Stop · Failure · Alarm are also indicated by card border color. Tapping the card navigates to the «Now» screen for that equipment |
| ③ | Alarm | Displays the icon of the highest grade and the count if active alarms exist |
| ④ | Status/OEE Not Applied | Equipment without status or OEE (e.g., meters) is placed at the end of the list as cards with «Status/OEE Not Applied» |
- To select a reason, leave a note, or call maintenance, tap the card to access the «Now» screen for that equipment.
- If the assigned scope only covers certain equipment in a line, only those equipment cards are visible.
Recording Stop Reasons
When equipment stops, a reason selection window automatically appears, except for Short Stops.
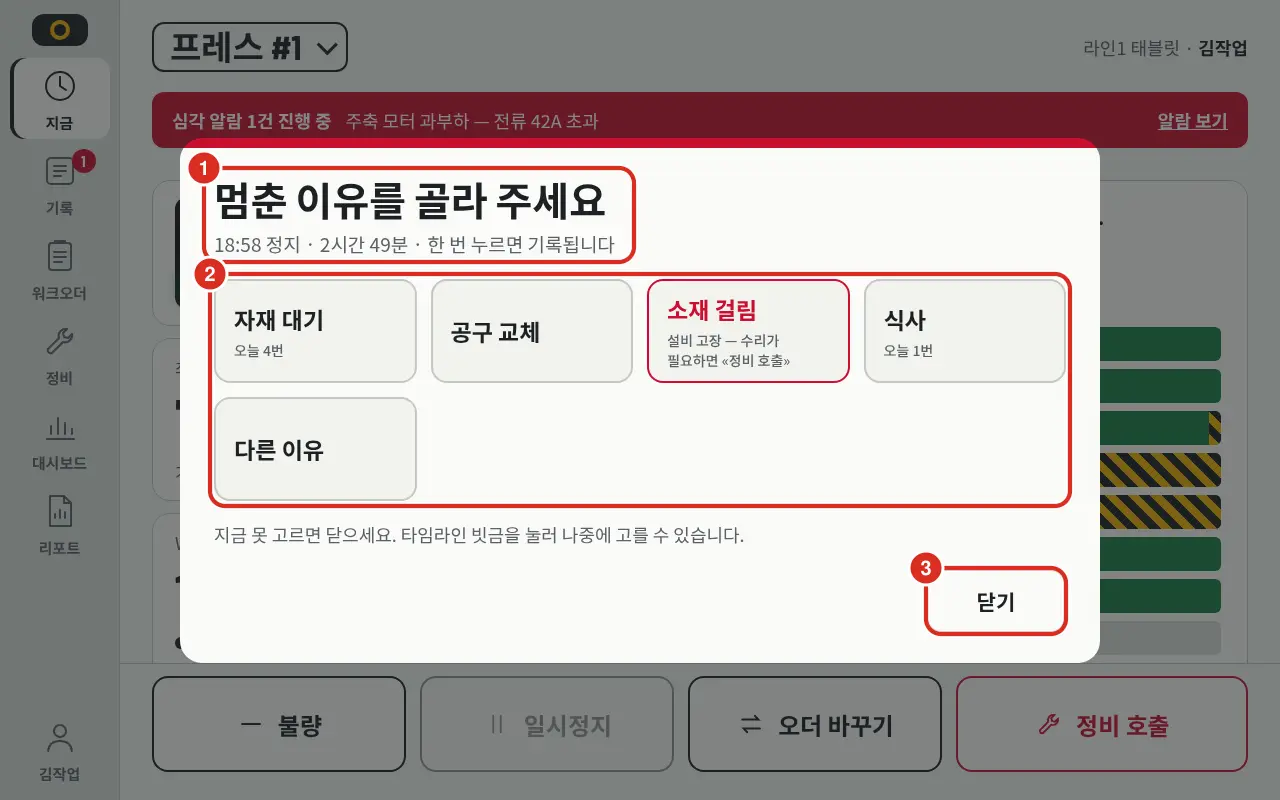
| Number | Location | Function |
|---|---|---|
| ① | Header | «Please select stop reason», followed by «18:58 Stop · 2 hr 49 min · One tap to record» indicating when it stopped and for how long. Equipment signals are displayed if available |
| ② | Reason Buttons | One tap to record. The administrator defines 6–8 buttons per equipment. If not in the list, select Other Reason from the full Platform cause dictionary |
| ③ | Close | «Close if you cannot select now. You can select later by tapping hatched cells on the timeline» — the stop remains as a hatched area on the timeline |
- If the administrator has not defined a reason list for the equipment, the most used reasons from the last 30 days are shown instead.
- If «Today N times» is attached to a button, it indicates how many times that reason was selected today.
- For equipment failure reasons, «Equipment Failure — Call maintenance if repair is needed» is attached. After recording the reason, request maintenance via Maintenance Call.
- If another user has already recorded the reason, «Another user has already recorded this» appears. Re-open to verify.
- Recorded reasons are stored as stop reasons on the Platform and used in Platform web screens, OEE, and reports.
- The Platform determines if a stop is a «Stop without reason» (stops that are not planned stops and have no user-recorded reason).
Short Stop
Stops that last shorter than the threshold and then resume are not asked for separately. Short stops occur frequently but occupy little total downtime; popping up windows for every short stop would hinder field operations.
- The threshold is a Platform setting
PP_STOP_MICRO_STOP_SECONDS. The default is 60s, adjustable from 0–1800s in the Platform console system settings. If set to 0, all stops are asked. The current value is view-only in the app's Kiosk tab. - Short stops do not trigger the automatic window and are not hatched on the timeline. They are drawn as regular stops, and the reason can be selected by tapping.
- The window appears the moment an active stop exceeds the threshold, without waiting for the next refresh.
- Short stops are excluded from the «Missing Reason» chip count and the «Stop without reason» list.
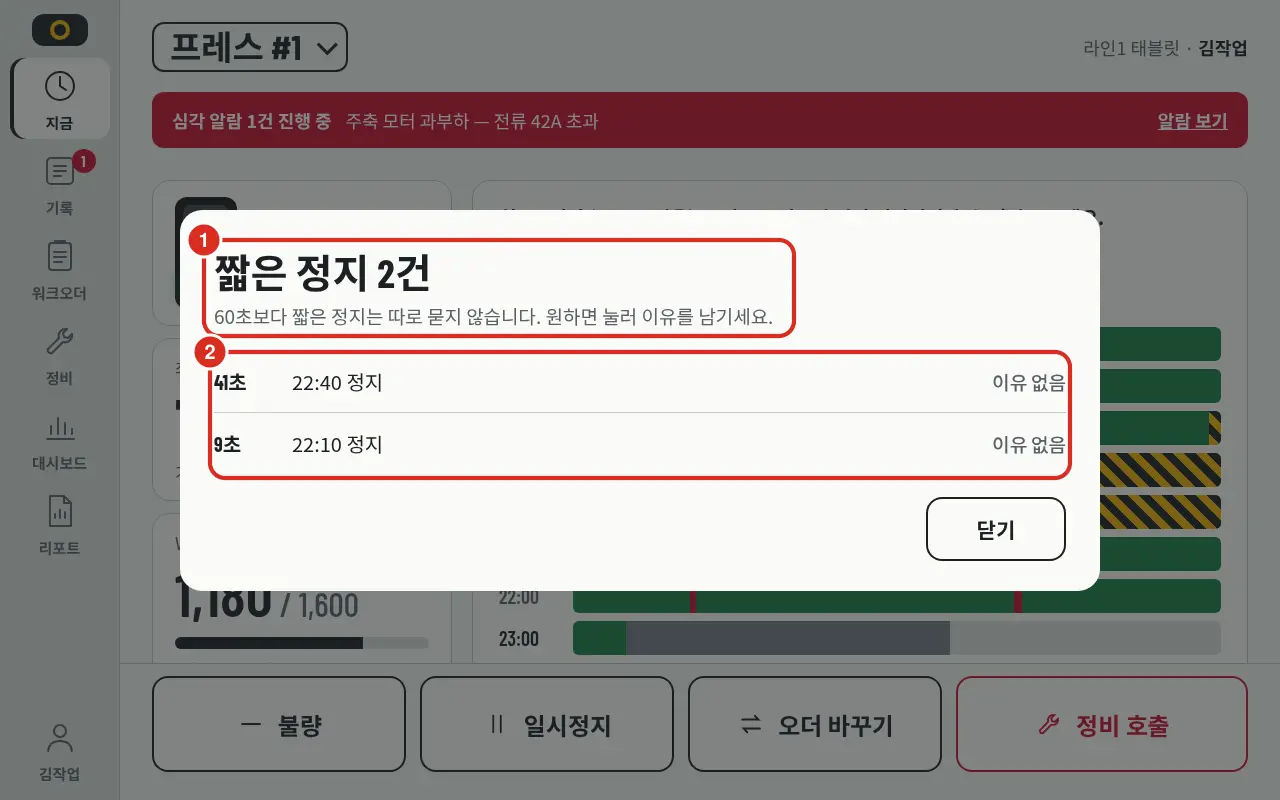
| Number | Location | Function |
|---|---|---|
| ① | Title · Notice | «Short Stop N cases», «Stops shorter than 60s are not asked for separately. Tap to record a reason if desired» |
| ② | Stop List | Lists stops from most recent, showing duration and time (e.g., «22:40 Stop») and reason. If no reason, «No reason». Tapping opens the reason window |
If there are no short stops, «No short stops this shift» (or «No short stops in the last 9 hours» if no schedule) is displayed.
Missing Reason and Quantity Correction
The list for filling in missing reasons is opened from the «Missing Reason N» chip at the top of the «Now» timeline. Quantity corrections and defect lists are opened in Work Order Details. There is no separate «Record» menu.
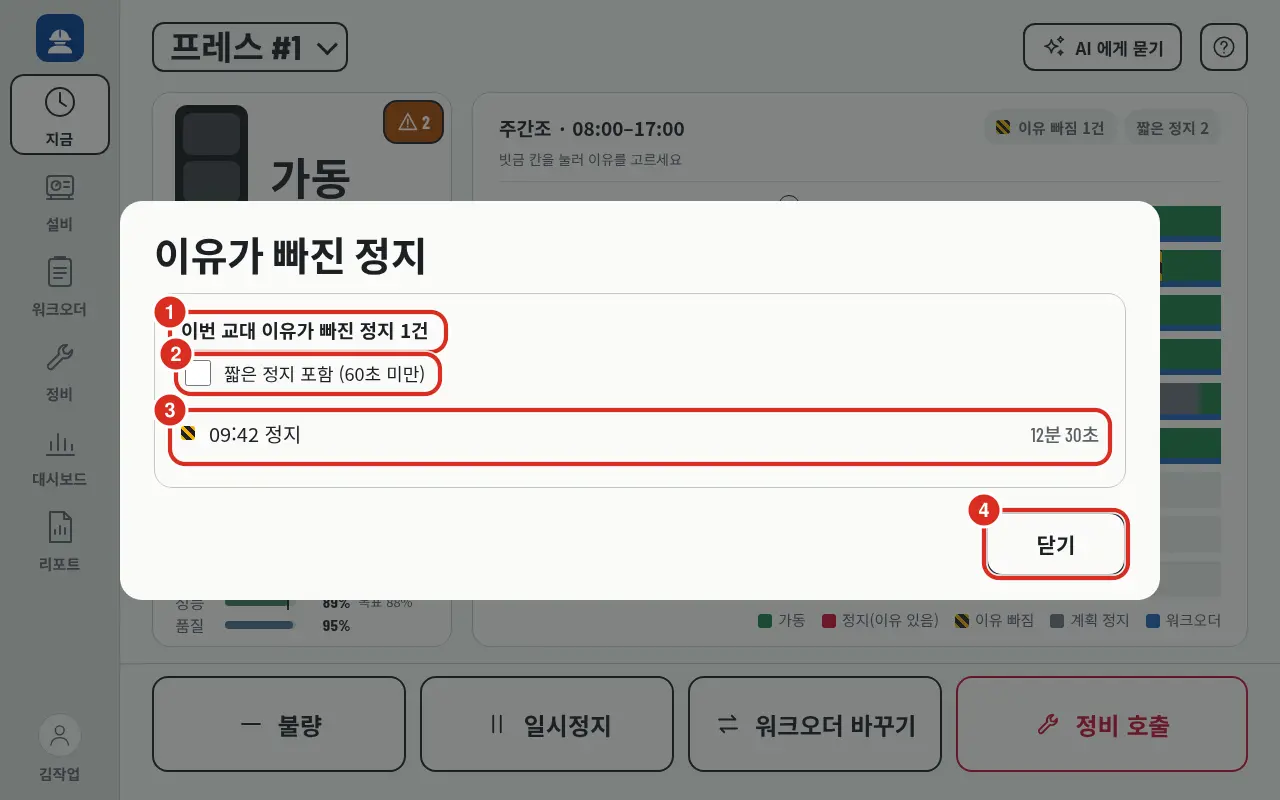
| Number | Location | Function |
|---|---|---|
| ① | Title | «Missing Reason 1 case this shift», or «Missing Reason N cases last 9 hours» if no schedule. This is the same window as the Now screen |
| ② | Include Short Stops | «Include Short Stops (under 60s)». When enabled, short stops are added to the list with a «Short» label |
| ③ | Stop List | Displays time (e.g., «09:42 Stop») and duration (e.g., «12 min 30 s») for each stop. Tapping a row opens the reason window |
| ④ | Close | Closes the list |
- If the window crosses midnight, items are grouped by date. If no missing reasons exist, «No stops without reasons» is displayed.
- The list count and the «Missing Reason N» chip always match as they use the same data.
- When completing and changing or ending (completing) a work order, the system asks «There are N stops without reasons» if any exist for that equipment. The user can choose «Select Now» to open the list or «Later» to proceed. This is not asked during pauses.
Quantity Correction
If the good/defect counts for an active work order are incorrect, tapping the Quantity Correction button in Work Order Details opens a correction field below the details. This is only possible while connected to the Platform — corrections are determined based on the counter value at that moment.
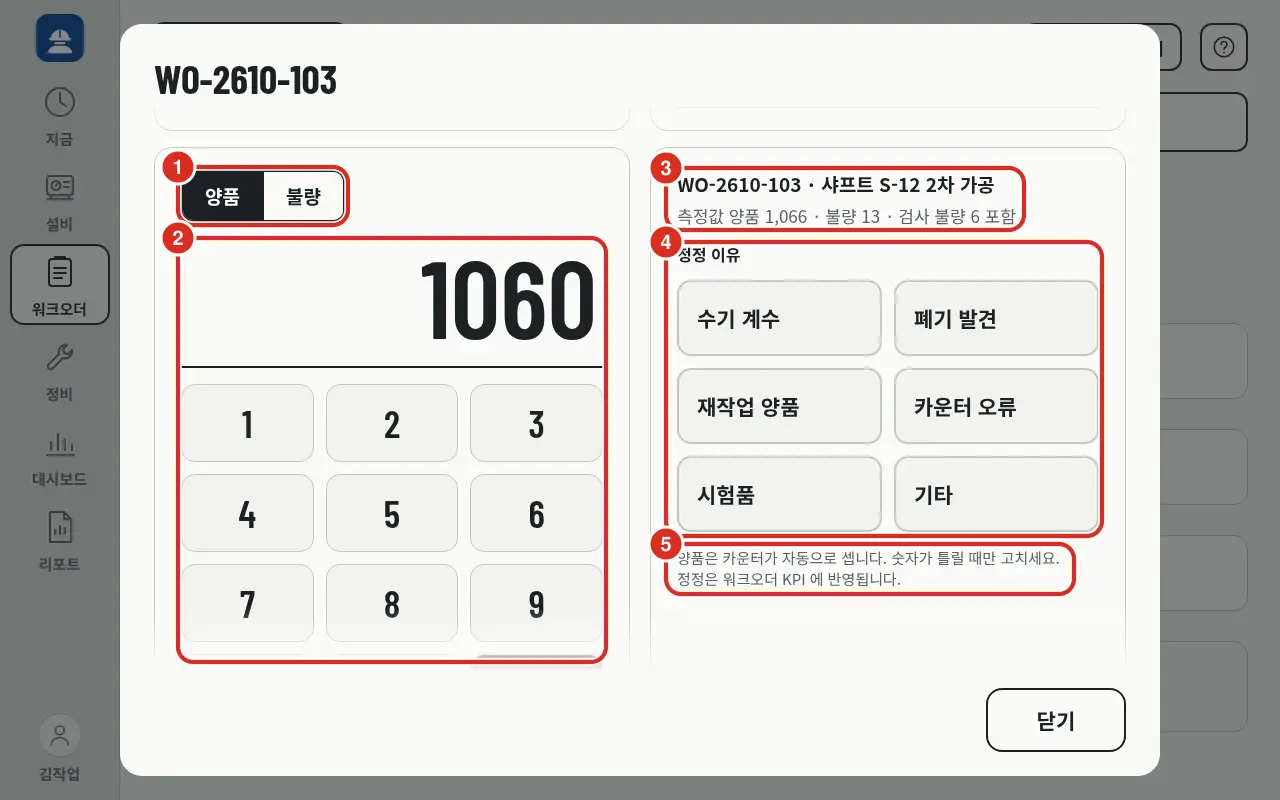
| Number | Location | Function |
|---|---|---|
| ① | Good / Defect | Select which number to correct |
| ② | Number Pad | Enter the Total corrected value — this is the total for the order, not the amount to add. Clear deletes one digit, and Save sends the correction |
| ③ | Order and Measured Value | Active order, «Measured Good 1,066 · Defect 13». If inspection defects are recorded, «Includes 6 inspection defects» is attached |
| ④ | Correction Reason | Manual Count · Scrap Found · Rework Good · Counter Error · Sample · Other. One must be selected («Select correction reason») |
| ⑤ | Notice | «Goods are automatically counted by the counter. Correct only when the number is wrong. Corrections are reflected in work order KPIs» |
- Goods are automatically counted. Correct only when the number is wrong.
- For equipment without PLC counters, use the Manual Count reason to enter the order quantity directly.
- Correction is not possible if no order is active or for equipment assigned as «View».
- Defects found during inspection are recorded via Defect Recording, not quantity correction.
Defect Recording
This records defects found during inspection among those already counted as good. The recorded quantity is transferred from «Good» to «Defect» for that order.
There are two ways to open this:
- Defect button on «Now» — records for the active order. If no order is active: «No active work order. For finished orders, open the work order in the work order screen to record».
- Defect button in Order Details — can record for finished orders if they were once started.
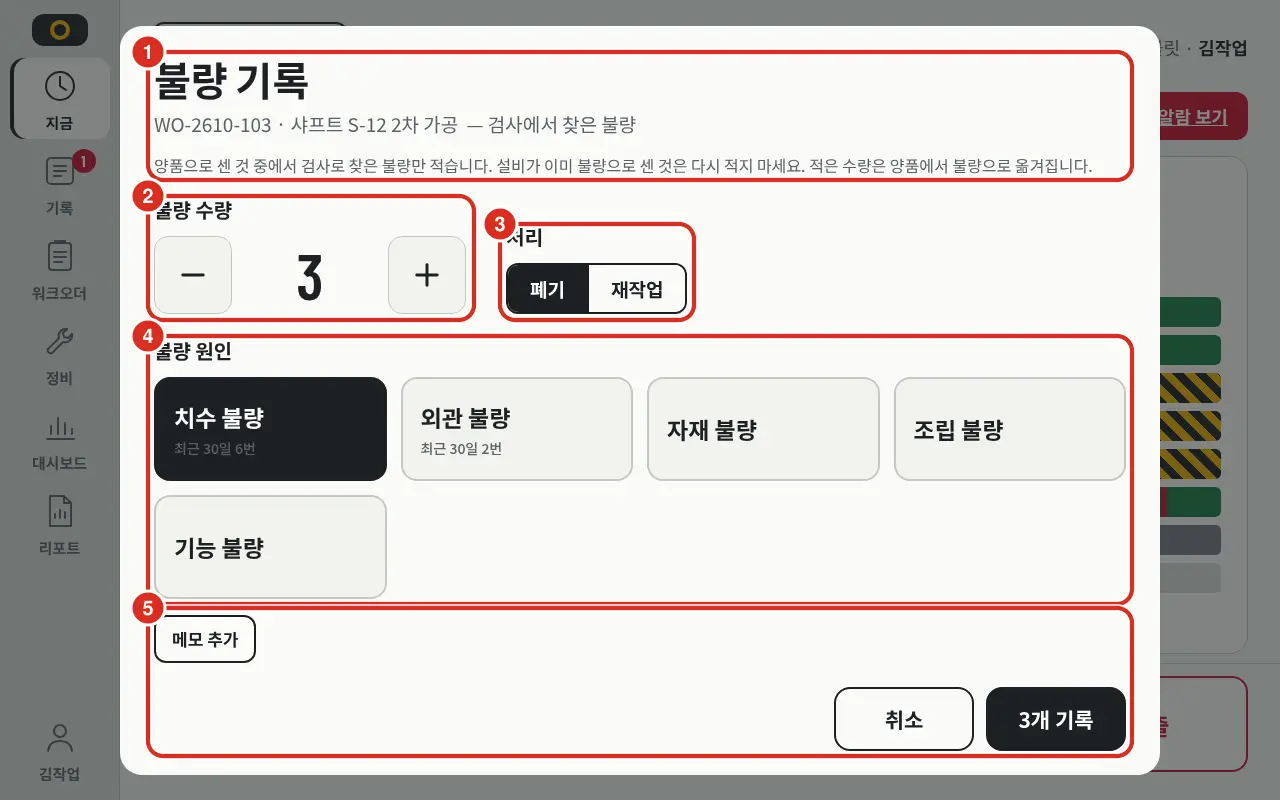
| Number | Location | Function |
|---|---|---|
| ① | Header · Rule | «Defect Recording», order number · name and «— Defects found during inspection», followed by «Only record defects found during inspection among those counted as good. Do not re-record defects already counted by the equipment. Recorded quantities will be moved from good to defect» |
| ② | Defect Quantity | Set from 1 using − / + |
| ③ | Handling | «Scrap» (default) or «Rework» |
| ④ | Defect Cause | Causes used for this equipment in the last 30 days appear first with «Last 30 days N times». Select one |
| ⑤ | Note · Send | Add a note via Add Note (optional, up to 1,000 characters). Send using the button indicating the quantity (e.g., «Record 3 units») |
- Upon sending, «Recorded N defects» appears. If disconnected, «Offline — Defect record saved; will be sent upon connection» appears, and it is recorded with the timestamp of the press once connected.
- If no causes are available, «No available defect causes. Administrator must enable causes in reference information» is displayed. Defect causes are managed in the Platform reference information.
- All four roles can record defects. Users with «View» only scope are blocked with «This equipment is view-only (Assigned Scope)».
| Refusal Message | Meaning |
|---|---|
| «Cannot record more defects than good units. Check quantity.» | Insufficient good units to transfer |
| «Work order has not started» | Cannot record for an order that hasn't started |
| «This work order cannot be modified further (modification limit). Notify admin.» | Reached Platform modification limit |
Canceling Defect Records
The defect list is located by scrolling down in Work Order Details.
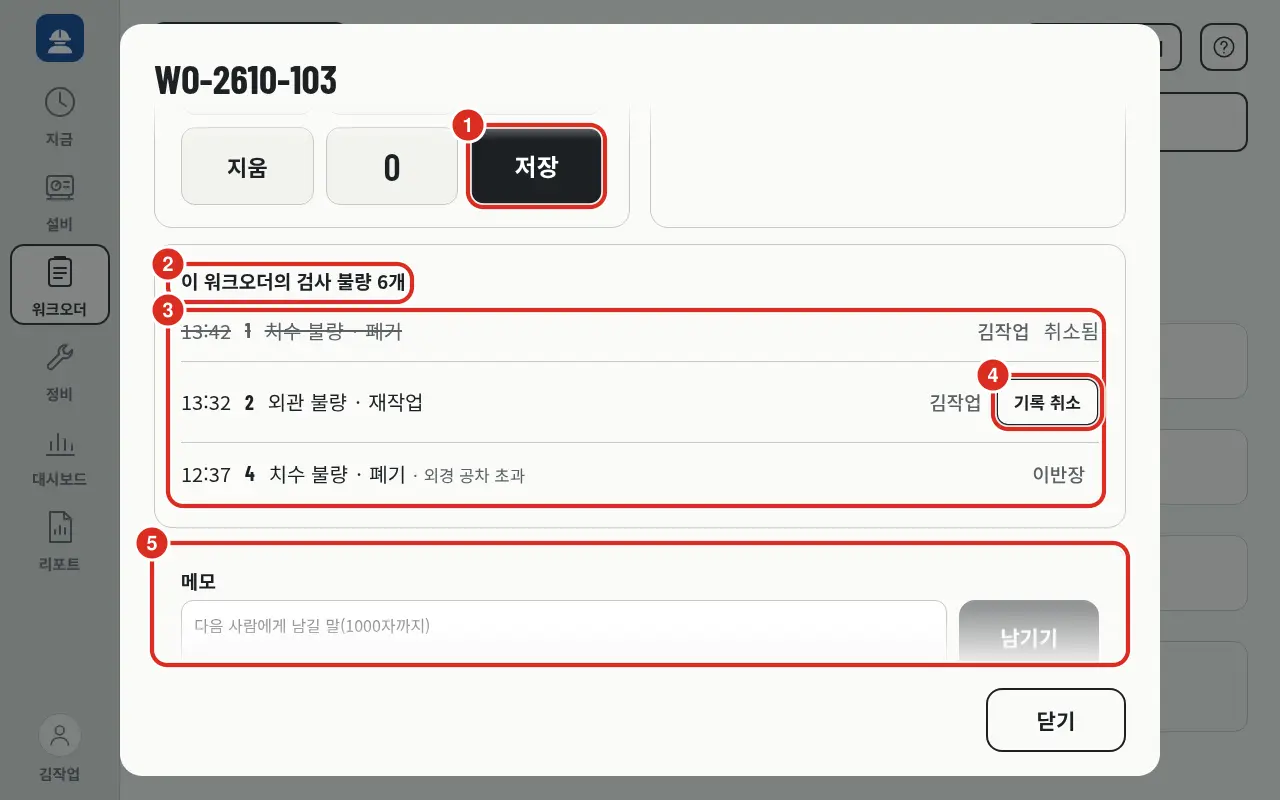
| Number | Location | Function |
|---|---|---|
| ① | Save | Sends the correction when the Quantity Correction field is open |
| ② | Title | «6 inspection defects for this work order». If none: «No recorded defects» |
| ③ | Defect List | Each row shows time, quantity, cause · handling (e.g., «Appearance Defect · Rework»), note, and recorder. Canceled rows are struck through and marked «Canceled»; rows from other systems are marked «Integration» |
| ④ | Cancel Record | Confirmation window shows «Cancel 2 appearance defect records. History is kept, and quantity reverts to good». Only available for eligible rows |
| ⑤ | Note | Write a note for the next person (up to 1,000 chars) and tap Leave Note. Notes are displayed below in reverse chronological order |
- Users can only cancel their own records. Foremen and Administrators can cancel all records. For others' records, «Only your own records can be canceled (Foreman/Admin can cancel all)» appears.
- Cancellation is only possible while connected («Cancellation is only possible while connected»).
Maintenance Call
If equipment needs repair, a maintenance call is made via the tablet. Maintenance personnel receive the call on the maintenance screen, start the repair, and close it as completed. Records are saved as maintenance orders on the Platform.
Requesting a Call
Any logged-in user can make a call, including those with «View» only scope.
There are three ways to request a call:
- Maintenance Call on «Now» (Equipment)
- Maintenance Call at the top of the Maintenance screen — if a line is selected, the equipment must be chosen first from «Which equipment?»
- Maintenance Call on the «Critical» alarm row in the Alarm list
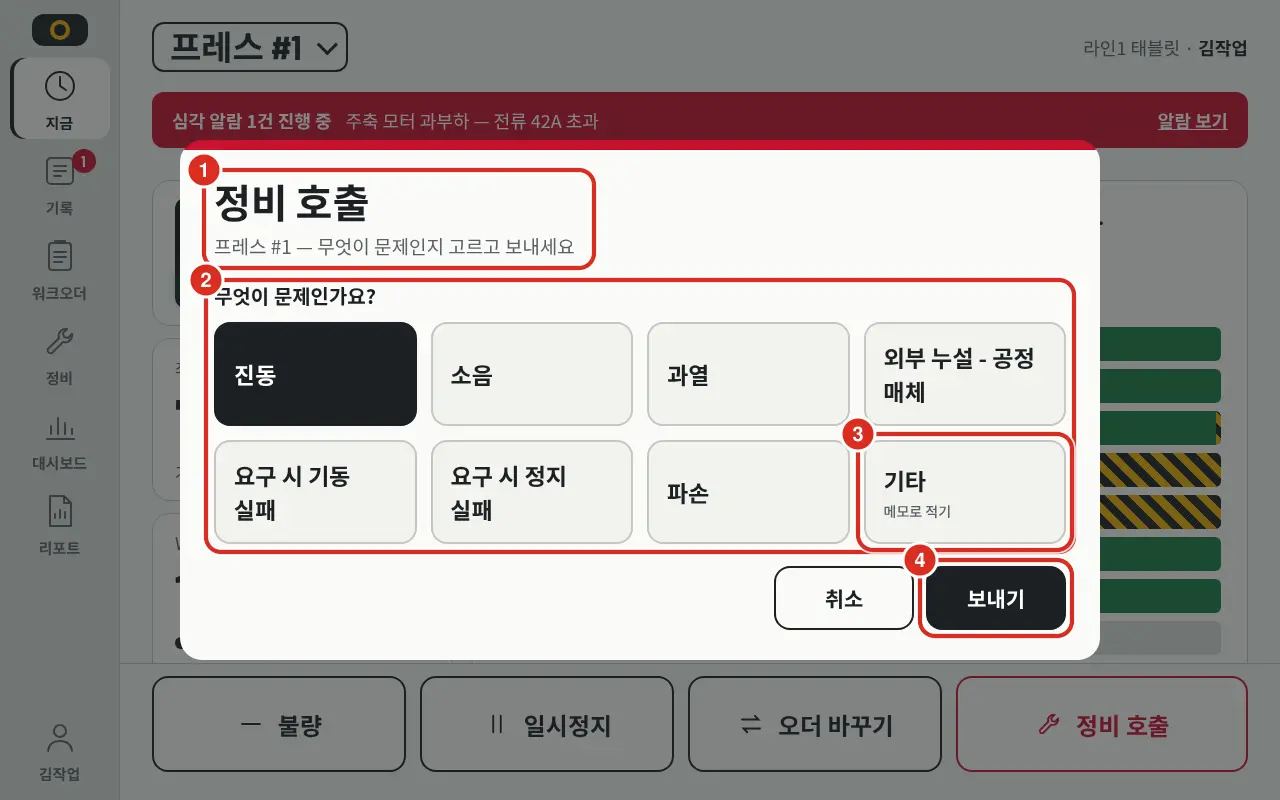
| Number | Location | Function |
|---|---|---|
| ① | Header | «Maintenance Call», followed by equipment name (e.g., «Press #1 — Select problem and send») |
| ② | Symptom Buttons | «What is the problem?» — Up to 7 failure modes (ISO 14224) for the equipment category. Select one |
| ③ | Other | If not in the list, tap «Other (Write note)» and describe the issue (up to 2,000 characters) |
| ④ | Send | Sends the request; «Maintenance called» is displayed |
- If no symptom or note is provided, «Please select a symptom or describe the problem» appears.
- For equipment without a symptom list, «No symptom list for this equipment category. Please use «Other» to describe» is displayed.
- If disconnected, «Offline — Call saved; will be sent upon connection» appears, and the request is sent once connected.
After calling, a call status bar appears at the top of the equipment's «Now» screen, updating every 15 seconds.
| Status Bar | Meaning |
|---|---|
| «Called — Waiting 5 min» | No one has accepted the call yet. Cancel button is only available at this stage |
| «[Name] on the way» | Maintenance personnel have accepted the call |
| «[Name] repairing» | Repair has started |
| «Offline — N maintenance calls not yet sent to maintenance» | Saved on tablet, not yet transmitted |
Maintenance Screen
The home screen for the Maintenance role. Open calls are displayed as cards, sorted by longest waiting time first.
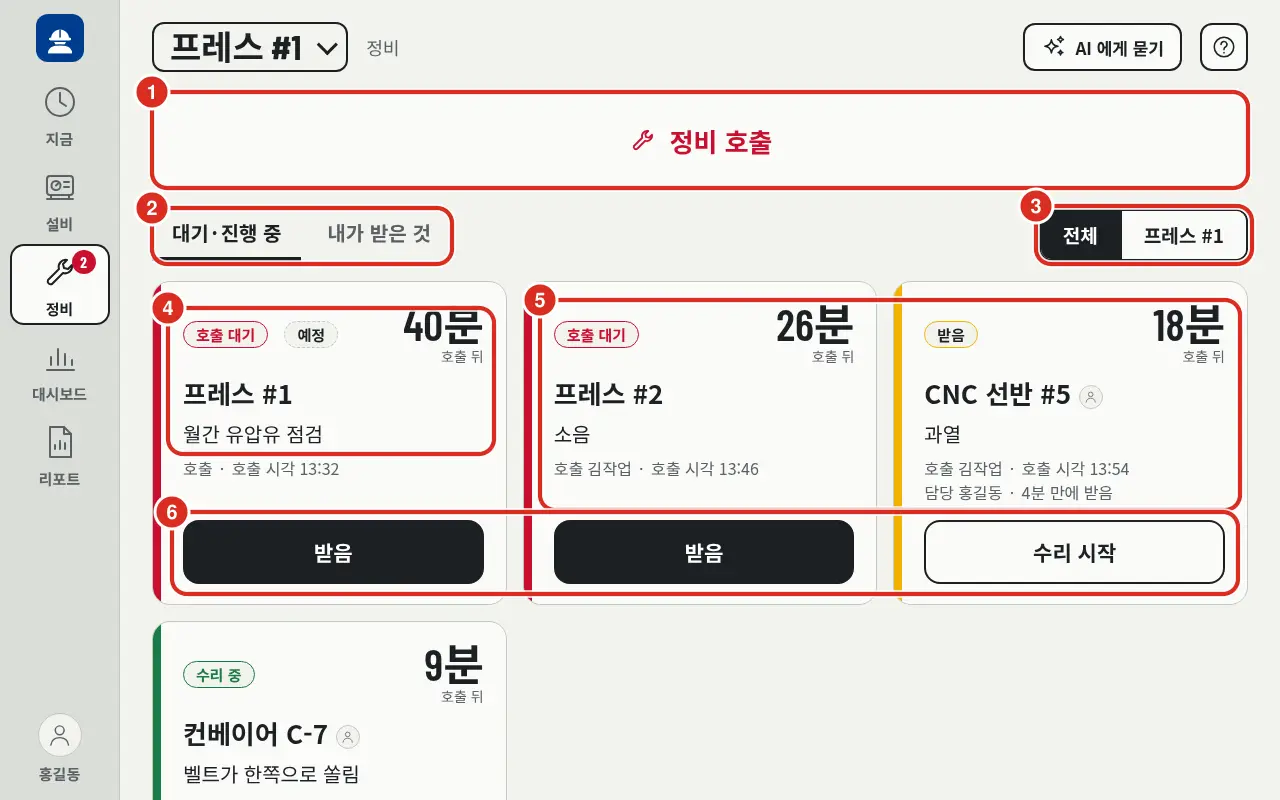
| Number | Location | Function |
|---|---|---|
| ① | Maintenance Call | Maintenance can also be requested from here |
| ② | Tabs | «Waiting · Active» · «My Calls». Only visible to Maintenance and Administrators; Workers and Foremen only see the «Waiting · Active» title |
| ③ | Scope | «All» or current equipment/line (e.g., «Press #1»). Visible in «Waiting · Active» tab when a line or equipment is selected at the top |
| ④ | PM Card | Card with «Scheduled» next to status. Created by the Platform's preventive maintenance plan; the task (e.g., «Monthly Hydraulic Oil Inspection») appears in the symptom field (first item below) |
| ⑤ | Call Card | Status («Wait» · «Accepted» · «Repairing»), time since call («26 min» and «Since call»), equipment, symptom, «Called by [Name]», «Call time 13:46». Accepted cards add «Assigned to [Name]», «Accepted in 4 min» |
| ⑥ | Stage Button | Depending on status: Accept · Start Repair · Complete. Only visible to Maintenance and Administrators. For unaccepted cards, the caller, foreman, and administrator see Cancel (Call Cancellation) |
- Tasks from the Platform's Preventive Maintenance Plan appear as cards. These are marked «Scheduled», show «PM Plan «…»» instead of the caller, and «Scheduled …» · «Created …» with time counted «Since creation». The stage button is Start Task instead of Start Repair, and «In Progress» during execution. «Anomaly Found» is attached if found during inspection. New PM cards do not have highlights or sounds.
- The screen refreshes every 10 seconds. New calls are highlighted for 8 seconds with a short sound (can be disabled by administrator in Kiosk).
- The number of open calls is attached to «Maintenance» in the left menu.
- Users with limited assigned scope only see calls for equipment in their scope.
- If no calls: «No pending maintenance calls» / «No calls assigned to me».
- If the Platform version does not support maintenance orders: «Platform maintenance order API not yet available» is displayed.
Accept, Repair, and Close
| Stage | Button | Who |
|---|---|---|
| Waiting → Accepted | Accept | Maintenance · Admin |
| Accepted → Repairing | Start Repair | Maintenance · Admin |
| Repairing → Completed | Complete — Opens repair completion window | Maintenance · Admin |
- Stage transitions are only possible while connected. If disconnected, «Unable to connect to server. Try again when connected» appears.
- If another user processed the call first, «Another user has already processed this. List refreshed» appears, and the list updates.
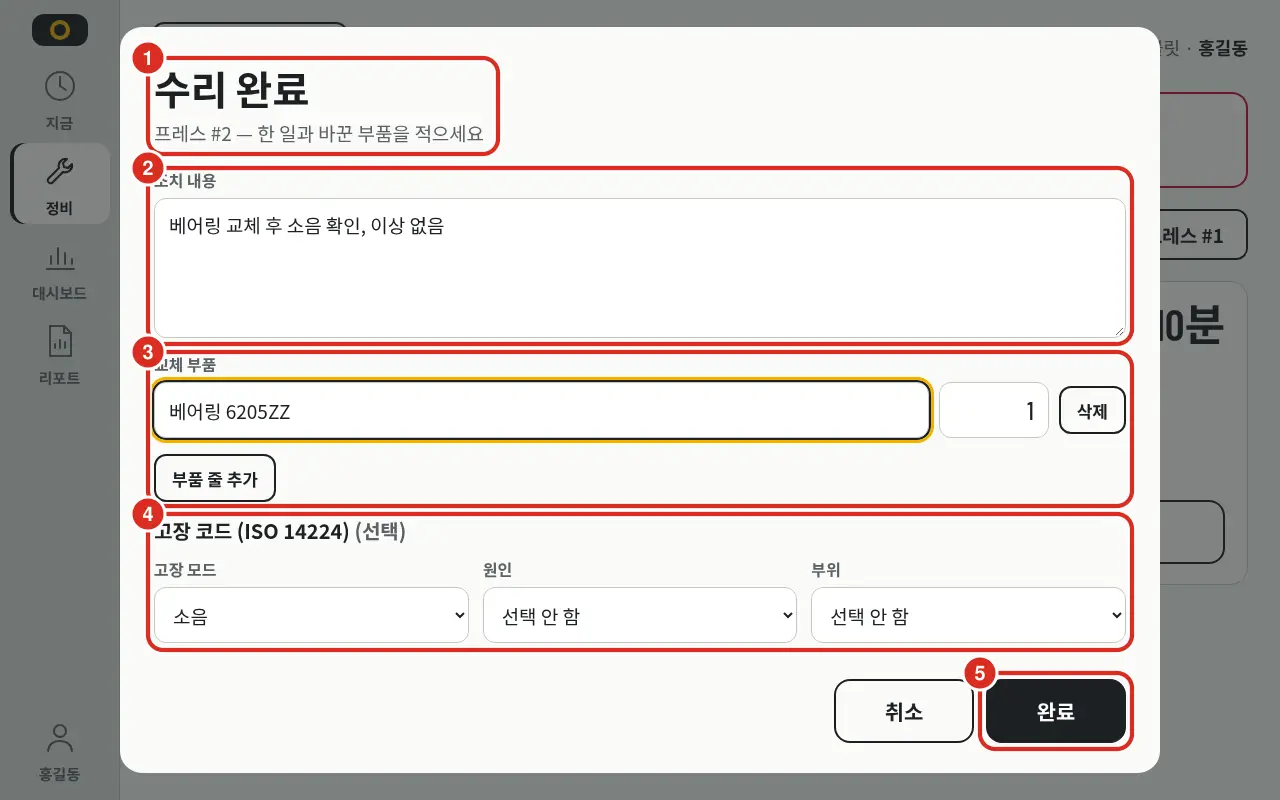
| Number | Location | Function |
|---|---|---|
| ① | Header | «Repair Complete», followed by equipment name (e.g., «Press #2 — Record actions and replaced parts») |
| ② | Action | Description of work performed (up to 4,000 characters) |
| ③ | Replaced Parts | Each row: part name (up to 200 chars) and quantity, Delete at end of row. Use Add Part Row to expand |
| ④ | Failure Code (ISO 14224) (Optional) | «Failure Mode» · «Cause» · «Location». «Not Selected» if left blank |
| ⑤ | Complete | Closes the call as completed |
All fields are optional.
For PM tasks, an «Inspection Item» section is added to the same window. For each item from the plan, users respond with «Normal» · «Anomaly», value (shows range like «Normal 10–20 bar»; «Out of Range» if exceeded), Take Photo, and note. Responses are saved as entered. If mandatory items are missing, «N mandatory items must be completed to finish» is displayed.
Call Cancellation
Calls can be canceled if made by mistake or if the issue was resolved on the spot.
- Only possible before the call is accepted (Waiting stage). For accepted calls, «Call cannot be canceled as it has already been accepted» is displayed.
- Only the caller, foreman, or administrator can cancel. Users with «View» only scope can only cancel their own calls.
- Only possible while connected. Calls saved on the tablet but not yet sent are deleted from the tablet upon cancellation.
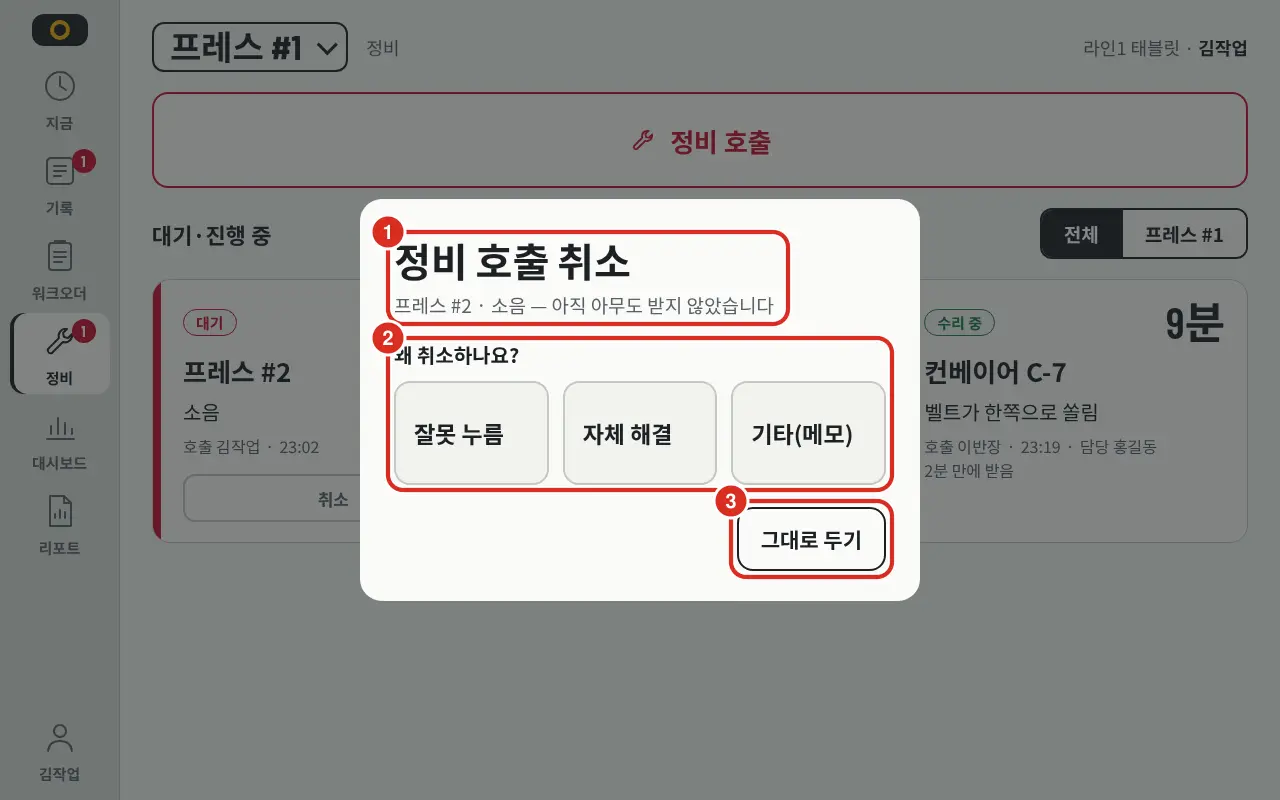
| Number | Location | Function |
|---|---|---|
| ① | Header | «Cancel Maintenance Call», followed by equipment and symptom (e.g., «Press #2 · Noise — Not yet accepted») |
| ② | Reason | «Why are you canceling?» — «Mistake» · «Self-Resolved» · «Other (Note)». Mistake and Self-Resolved cancel immediately upon tapping. «Other (Note)» opens a note field and a Cancel button; a note must be written to cancel |
| ③ | Keep | Closes the window without canceling |
Upon cancellation, «Call has been canceled» appears.
Alarm
Displays active alarms and those ended today sent from equipment to the Platform. The screen refreshes every 10 seconds.
- Alarm indicator on «Now» status card — If active alarms exist, the icon of the highest grade (Critical octagon «!» · Warning triangle «!» · Info circle «i») and the count appear at the top right of the status card. Icons blink if Warning or higher has not been acknowledged. Tapping opens the list below. No indicator appears if there are no alarms.
- Number in left menu «Equipment» — Count of active alarms for the current equipment (or line equipment).
- Line card — Each equipment card displays the grade icon and count for active alarms.
- «Equipment» menu — View alarms up to the last 30 days in «Active Alarms» and «Alarms» tabs (Equipment).
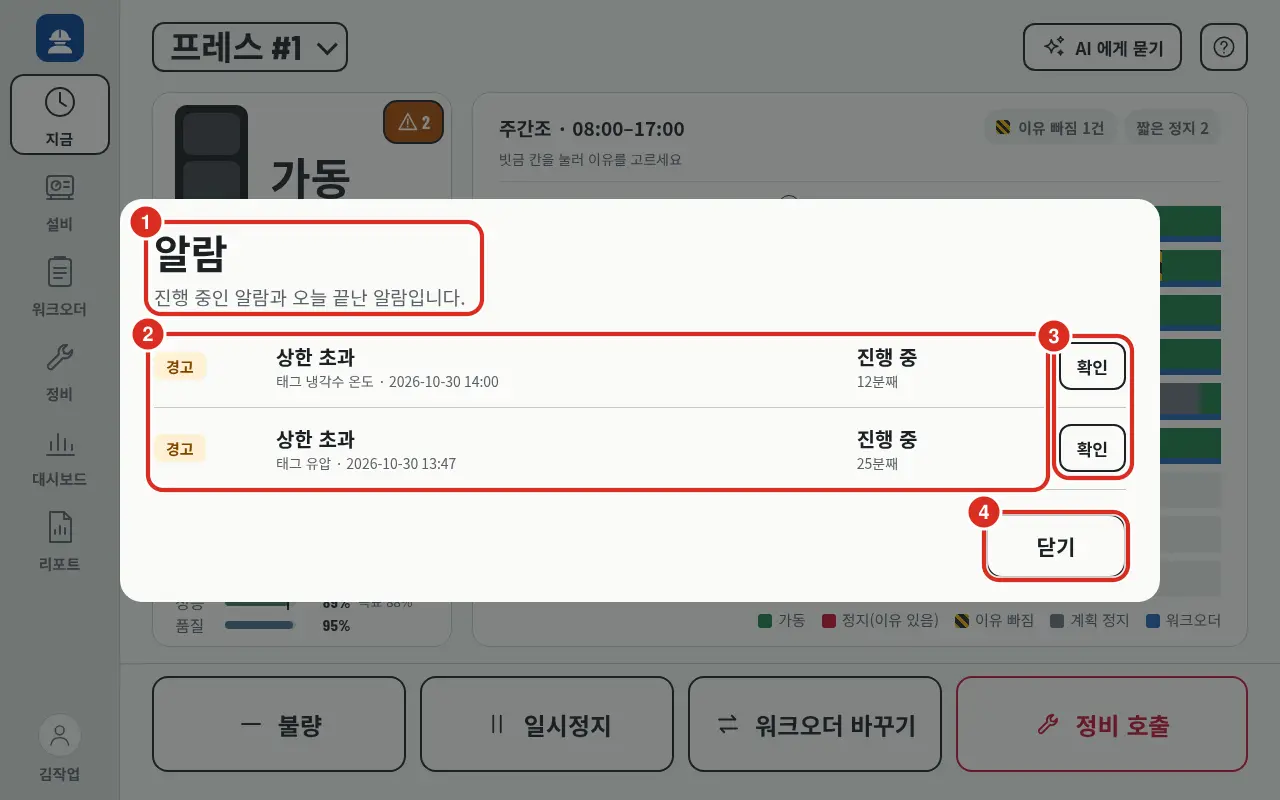
| Number | Location | Function |
|---|---|---|
| ① | Title · Notice | «Alarm», «Active alarms and alarms that ended today» |
| ② | Alarm Row | Active alarms first, sorted by severity (Critical first). Each row shows grade (Critical · Warning · Info), text (e.g., «Upper Limit Exceeded»), tag and occurrence time (e.g., «Tag Cooling Water Temp · 2026-10-30 14:00»), and «Active» with duration (e.g., «12 min»). Rows ended today show duration («24 min») and end time («End 20:52») |
| ③ | Acknowledge | Only available for unacknowledged rows |
| ④ | Close | Closes the list |
- «Critical» active alarm rows include a Maintenance Call button — Maintenance Call.
- Multiple occurrences of the same alarm are grouped into one row and expanded via «3 cases · Expand».
- Tapping Acknowledge records the acknowledgment on the Platform under the user's name. Acknowledgment is global; once one person acknowledges, blinking stops on all tablets. The button is disabled for «View» only users. Audit logs are recorded as
ALARM_ACK. - There is no button to clear (reset) alarms. There are no sounds or vibrations. Clearing is handled on the Platform.
- If no alarms exist: «No active or today-ended alarms».
Equipment
The «Equipment» left menu provides a detailed view of a single piece of equipment. If the scope is a line, the user must first select equipment from «Which equipment to view?».
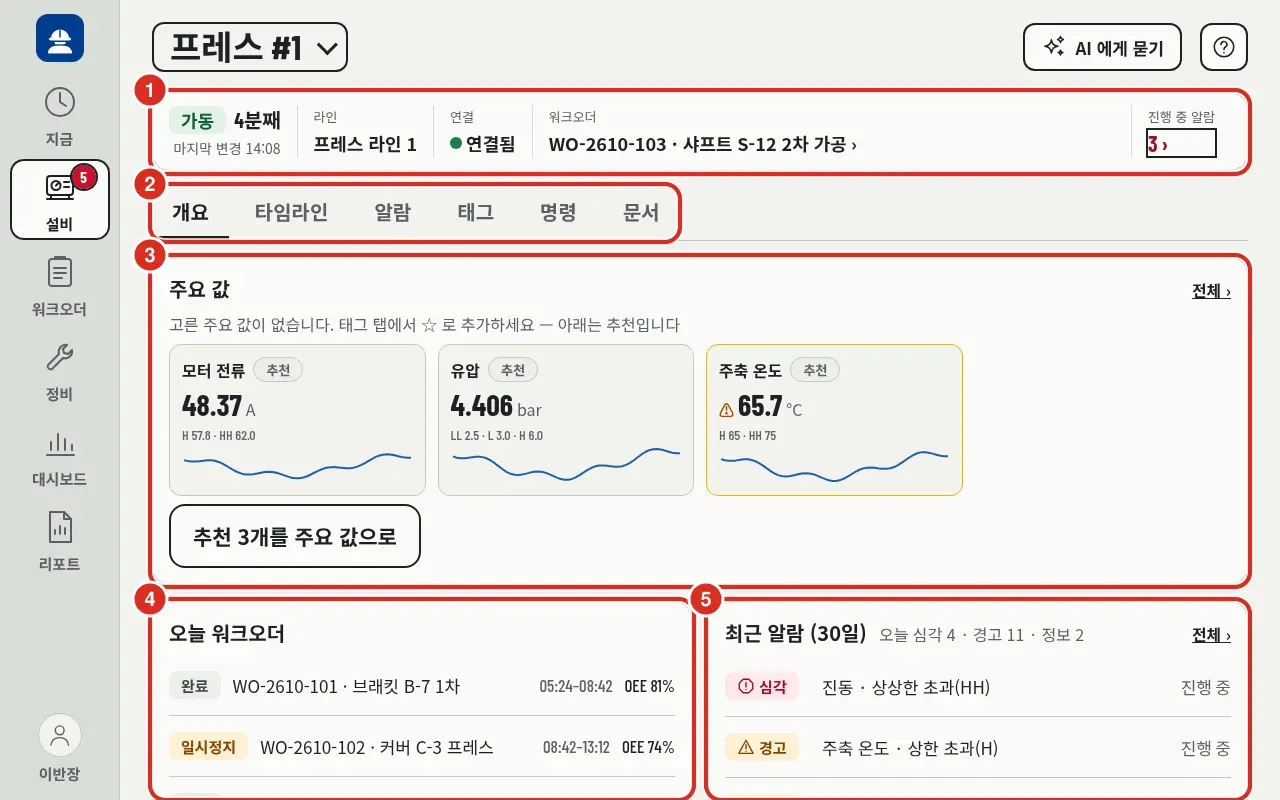
| Number | Location | Function |
|---|---|---|
| ① | Header | Status and duration (e.g., «Running 4 min»), «Last Change 14:08», «Line», «Connection» («Connected»), current «Work Order» (tapping opens details), «Active Alarm» count (tapping opens «Alarm» tab) |
| ② | Tabs | Overview · Timeline · Alarm · Tag · Document. «Command» tab is also visible if enabled by admin in Kiosk |
| ③ | Key Values | Selected tag values (up to 6) and units, alarm limits (e.g., «H 57.8 · HH 62.0»), and 1-hour trend line. ⚠ is attached if limits are exceeded. If none selected: «No key values selected. Add via ☆ in Tag tab — See recommendations below» with 3 recommendations and a Set 3 Recommendations as Key Values button |
| ④ | Today's Work Orders | Today's work orders with status, time, and OEE |
| ⑤ | Recent Alarms (30 Days) | «Today: Critical 4 · Warning 11 · Info 2» and recent alarms. «All ›» opens the Alarm tab |
- Scrolling down reveals «Recent Status Changes».
- Tag tab — All equipment tags («Process Value» at top, «Counter/Status» at bottom) with value, unit, alarm limit, and 1-hour trend. Tapping a row opens trends (1 · 9 · 24 hours); tags can be added/removed from key values via ☆ (available to users with «Work» assignment; shared globally).
- Alarm tab — «Active» at top, «Past Alarms (30 Days)» below. Filter by grade (All · Critical · Warning · Info). Same tag and grade are grouped (e.g., «16 cases»). Tapping shows occurrence/clearance time, alarm text, and alarm limits.
- Document tab — Documents uploaded from the console's equipment screen. Download via Receive. If none: «No documents uploaded».
- Command tab — Currently displays «Command execution is being prepared on Platform» and performs no actions.
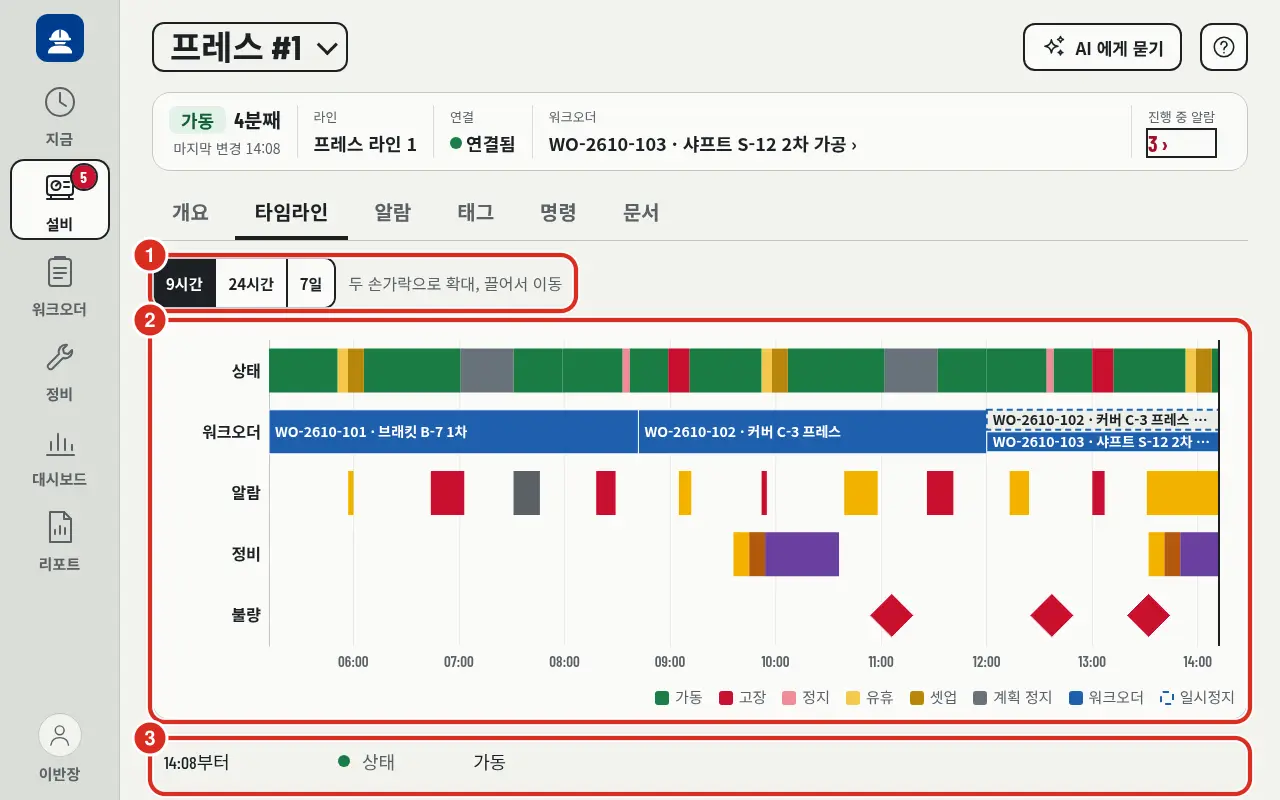
| Number | Location | Function |
|---|---|---|
| ① | Period | «9 Hours» («Now» time window) · «24 Hours» · «7 Days». «Pinch to zoom, drag to move» |
| ② | Chart | Status · Work Order · Alarm · Maintenance · Defect on separate lines in one chart. Work order pauses are dotted lines. Tapping a bar reveals the event (stop reason, work order, alarm, maintenance call, defect) |
| ③ | List | Corresponding records below the chart in reverse chronological order (e.g., «From 14:08 · Status · Running») |
- In the «7 Days» view, only status, work orders, and alarms are visible («Only status, work order, and alarm are visible for 7 days. Maintenance, defect, and stop reasons are available up to 24 hours»).
Opening Equipment via QR Label
If equipment has a QR Label, tap Open in frontline on the public page. The app opens; if not logged in, the user is prompted to log in and then navigated to the «Now» screen for that equipment.
| Message | Meaning |
|---|---|
| «That equipment is outside the assigned scope of this account/tablet.» | The equipment is not assigned to this user or tablet |
| «This QR label is no longer in use (reissued).» | The label has been reissued; scan the new label |
| «Unable to connect to server. Please scan again when connected.» | Connection lost |
| «Failed to open QR label. Please scan again.» | Other error |
A scanned label is read once. To reopen, scan again.
Work Order
Find planned orders on the Platform and Start · Pause · Resume · End · Abort them. Creating or modifying orders is done on the Platform web (Production Management). Transitions pressed while disconnected are saved on the tablet and sent in order upon reconnection, recorded with the timestamp of the press (When Connection is Lost).
Foremen start on this screen upon login, with «This entire line» selected.
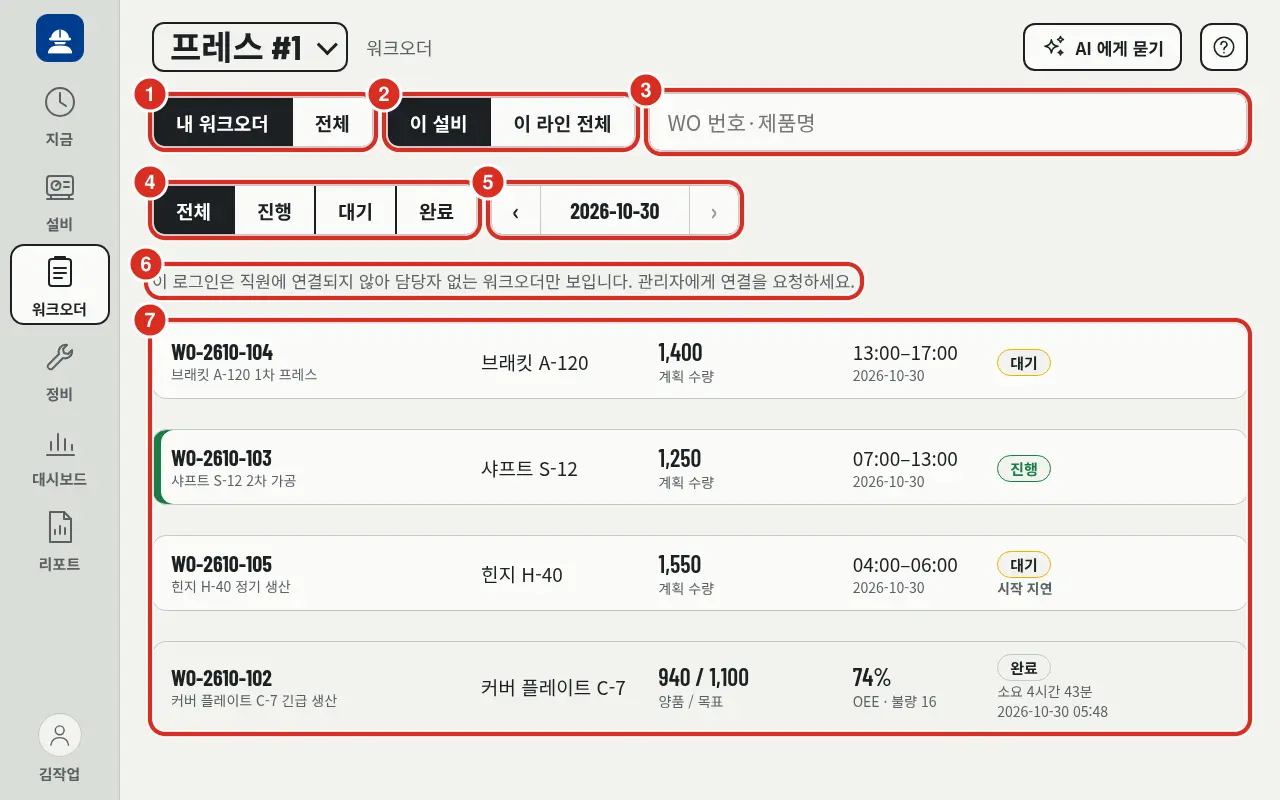
| Number | Location | Function |
|---|---|---|
| ① | Assignee | «My Work Orders» · «All». «My Work Orders» includes orders assigned to the user and orders without an assignee. Workers start on «My Work Orders»; other roles start on «All» |
| ② | Scope | «This Equipment» · «This Entire Line». Not available on line tablets, which only show that line |
| ③ | Search | «WO Number · Product». Search by customer MES WO number. Search is performed within loaded orders |
| ④ | Status | All · Active · Waiting · Completed. Selecting Completed shows a period «Last 7 Days» (default) · «Last 30 Days» instead of a date, sorted by end time |
| ⑤ | Date | Single field with ‹ (previous day) · Date (tapping opens calendar) · › (next day). › and calendar only go up to today. If moved to another day, «Today» is displayed next to it. Shows orders with plans or actuals overlapping that day; orders crossing midnight appear on both dates |
| ⑥ | Notice | If login is not linked to a Platform employee, «This login is not linked to an employee, so only work orders without an assignee are visible. Request link from admin» |
| ⑦ | Order Row | WO number and name, item (shows «Assignee …» if present), «Planned Qty» (standard time or completion rate for time-based), planned time, status. «Start Delay» is attached if late. Completed rows show «Good / Target» («Running / Std» for time-based), «OEE · Defect N», «Duration N», and end time. Active rows have a green band on the left |
- In this equipment view, tapping a waiting or paused order opens the Start Confirmation window. All other cases (line view, active/completed orders) open Order Details.
- Orders deviating from the plan are marked «Start 10 min late» · «End 10 min late» · «10 min past planned end» · «Replanned 2 times».
- If equipment does not belong to a line, «This equipment does not belong to a line, so the entire line cannot be viewed» is displayed.
- Up to 500 cases are shown. If exceeded: «Too many work orders; only the first 500 are shown. Reduce period or search».
- If nothing matches «My Work Orders»: «No work orders assigned to me. Other work orders can be viewed in «All»».
- Users with limited assigned scope only see orders within their scope.
Starting an Order
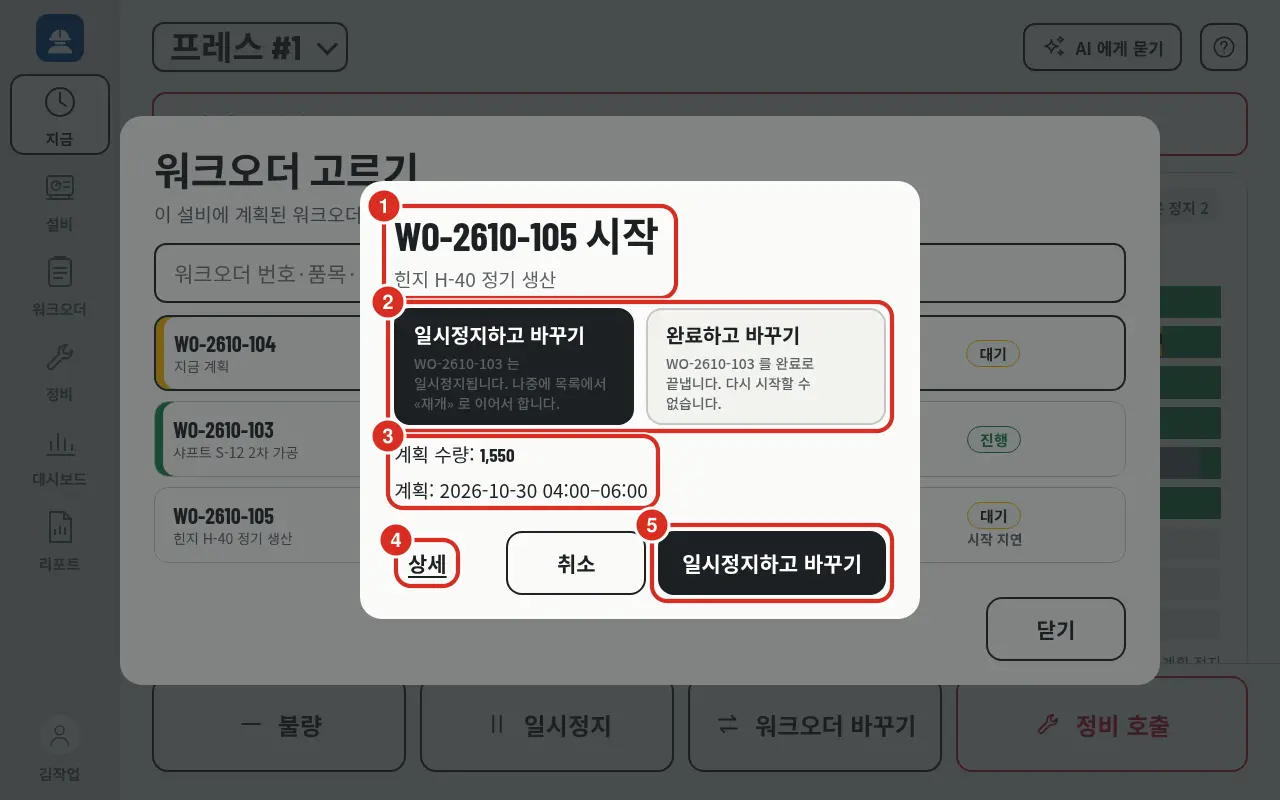
| Number | Location | Function |
|---|---|---|
| ① | Title | Order number to start (e.g., «WO-2610-105 Start»), followed by order name |
| ② | Active Order | Appears only when a work order is already active on this equipment. Choose between Pause and Change (default) or Complete and Change (see below) |
| ③ | Plan | «Planned Qty» and «Plan» (planned time) |
| ④ | Details | Opens order details before starting |
| ⑤ | Start | Starts the order. Button is named Start (or Resume for paused orders); if ② is present, the selected option becomes the button name. «Cancel» closes the window |
- If a work order is already active on this equipment, the confirmation window provides two options for that order (②). The selected option becomes the Start button's name, performing both the previous order's cleanup and the new order's start in one step.
- Pause and Change (default) — «WO-… will be paused. Continue later from the list via «Resume»».
- Complete and Change — Tapping asks «Complete WO-…?» and shows «Current Good N / Target N (N%)» and «Once completed, actuals are finalized and cannot be restarted».
- If the previous order ended or paused but the new order start fails, «Previous work order ended, but failed to start WO-…» is displayed with a Start Again button.
- When starting an order assigned to someone else, «Another Assignee» — «This is [Name]'s work order. Start anyway?» is asked.
- Late starts are allowed. Waiting orders past their planned end can be started, and starts earlier than planned are not blocked.
| Refusal Message | Meaning |
|---|---|
| «Cannot start as there is already an active work order on this equipment» | Another tablet started the work order first |
| «This action is only allowed for Foremen/Administrators» | Role does not permit the action |
| «Another user changed this first. Refresh the list.» | Order status changed in the meantime |
| «Failed to change work order» | Other refusal |
Selecting Order — From «Now» Screen
Tapping Change Work Order on the «Now» screen opens «Select Work Order» with orders available for that equipment. This includes active, paused, and waiting orders whose planned end was within the last day.
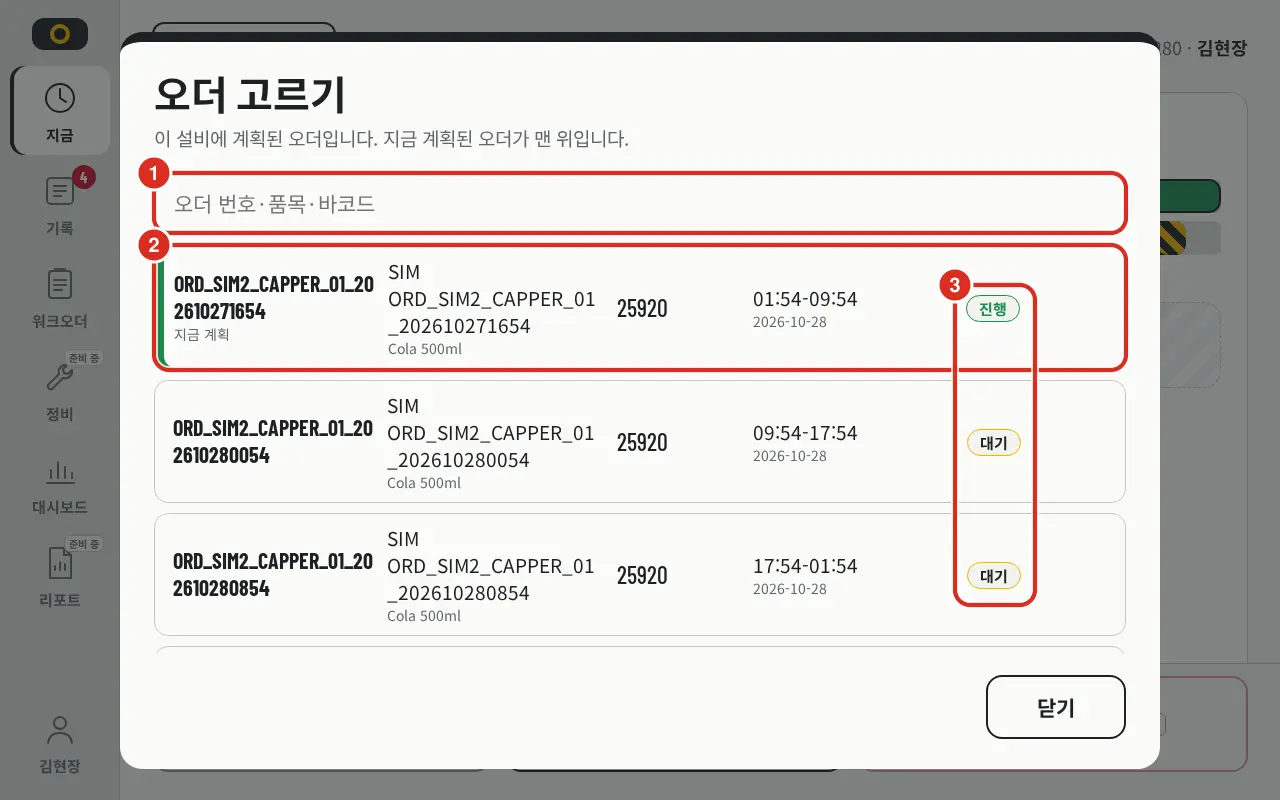
| Number | Location | Function |
|---|---|---|
| ① | Search | «Work Order Number · Item · Barcode» |
| ② | Currently Planned Order | Orders the Platform identifies as currently planned are listed at the top with «Now Planned» |
| ③ | Status | Active · Waiting · Paused · Completed · Aborted. Standard time is shown for time-based waiting orders |
Order Details
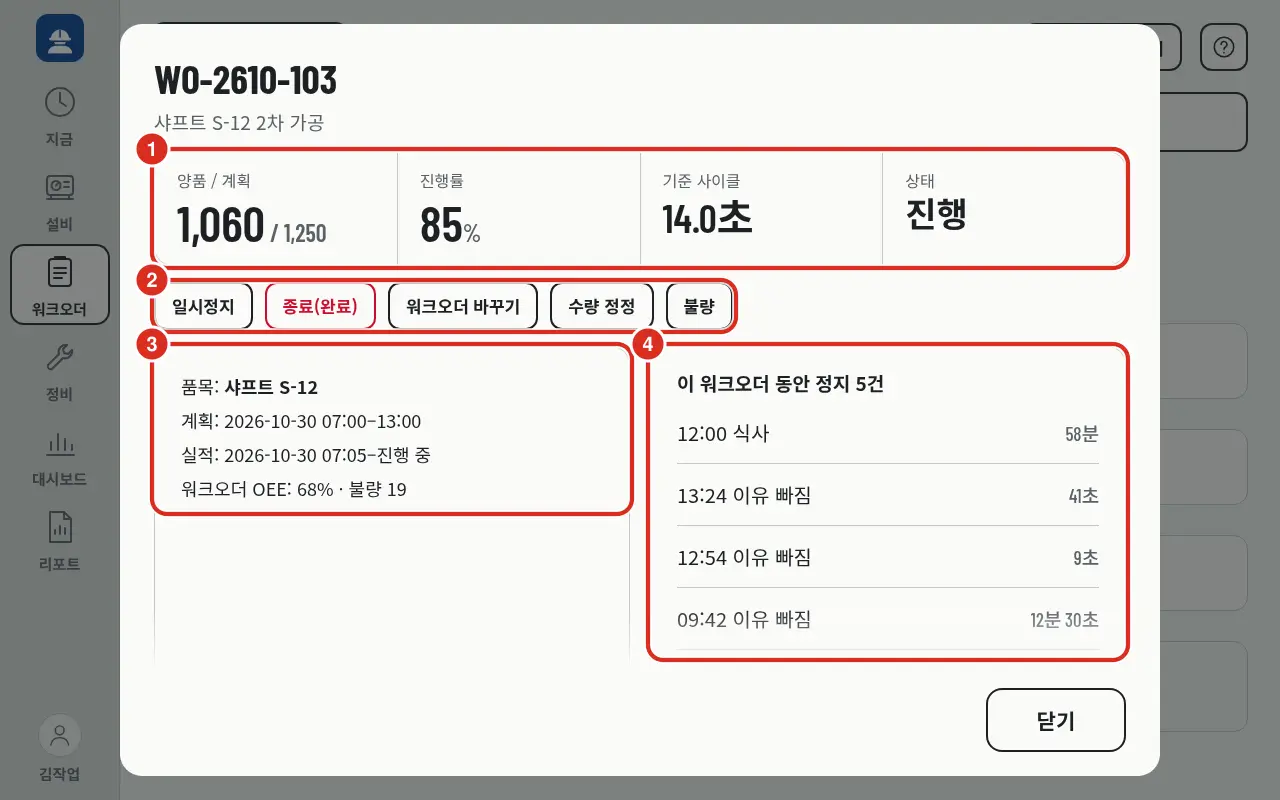
| Number | Location | Function |
|---|---|---|
| ① | Quantity · Status | «Good / Planned», «Progress Rate», «Std Cycle» (or «Not Set»), «Status». Time-based orders show «Running / Std» |
| ② | Actions | If active: Pause · End (Complete) · Abort · Report Completion Rate (time-based) · Change Work Order · Quantity Correction · Defect. If paused: Resume · End (Complete) · Abort. Abort is only visible to Foremen and Administrators. Completed (End/Abort) orders have no «Change Work Order»; time-based orders have no «Quantity Correction» |
| ③ | Order Info | «Item», «Plan», «Actual» (shows «… – In Progress» if active), «Work Order OEE: 68% · Defect 19». Deviations from plan are noted as «vs Plan: …». Time-based orders show «Last Report: 60% · [Name] · Time» |
| ④ | Stops During This Order | «5 stops during this work order» — stops and reasons, duration during the order. No reason is marked «Missing Reason»; planned stops show type (e.g., «Meal»). Tapping allows reason selection. If too many, «Showing stops from the last 31 days only» |
Scrolling down reveals further sections.
- Quantity Correction — Only opens when the Quantity Correction button above is tapped — Quantity Correction.
- Inspection Defects for This Work Order — «N inspection defects for this work order» and Cancel Record for each row. If none: «No recorded defects» — Cancel Defect Recording.
- Notes — Write notes for the next person and view existing notes in reverse chronological order. The note chip on the «Now» active work order card also opens this.
- Change History — Chronological log of events: Creation · Start · Pause · Resume · End (Complete) · Abort · Cancel · Delete · Plan Change · Early Start · History Start. Interleaved are «Quantity Correction» («Good N · Defect N»), «Recorded N defects», «Canceled N defect records», and «Progress Rate Reported N%» with timestamps. Plan changes show the modified field. Actions are recorded under the Name of the tablet user (employee ID if not registered in app); automated plan changes are marked «Auto (Plan)».
If another user changed the order status first, «Another user changed this first» appears. Refresh the list.
Ending and Aborting
End (Complete) is for finishing an order after completing production; Abort is for stopping an order before completion. In either case, a finished order cannot be restarted.
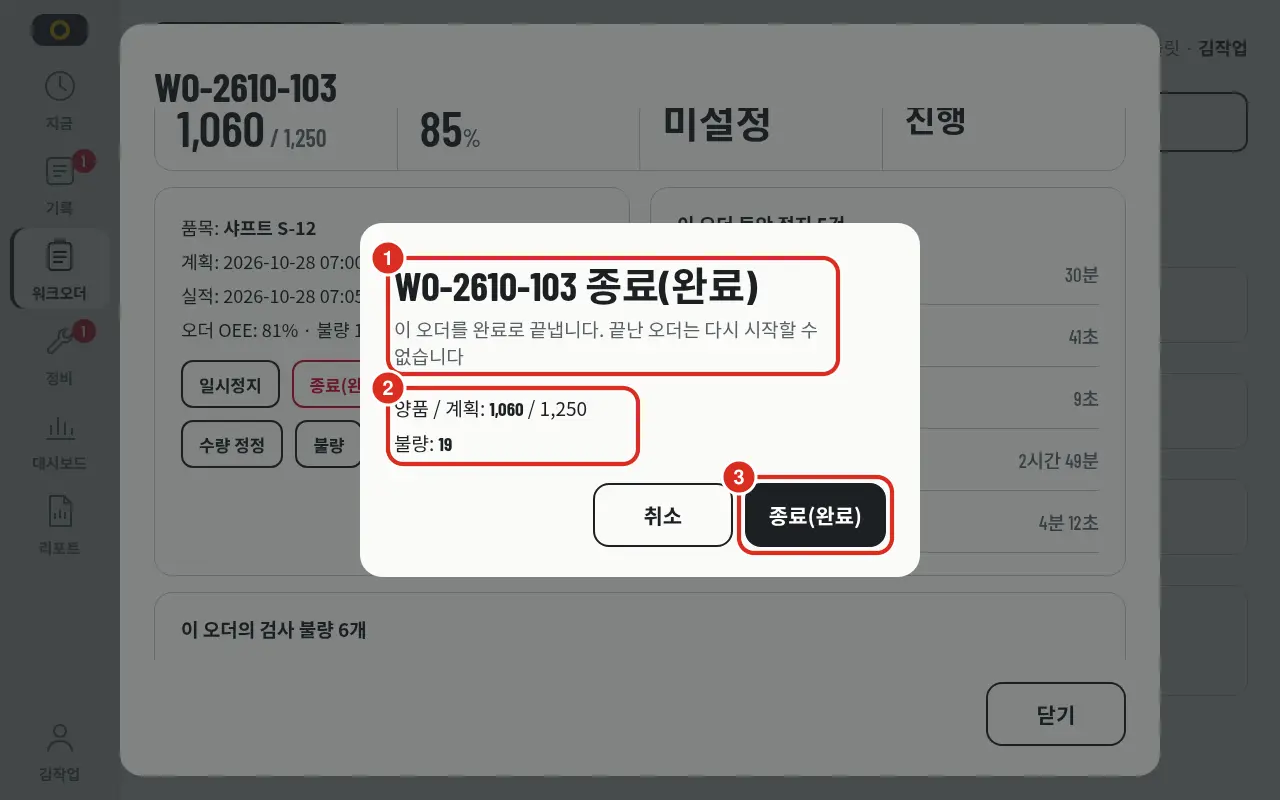
| Number | Location | Function |
|---|---|---|
| ① | Title · Notice | «WO-2610-103 End (Complete)», «End this work order as complete. Completed work orders cannot be restarted» |
| ② | Quantity | «Good / Planned» and «Defect» at the time of ending |
| ③ | End (Complete) | Ends the order |
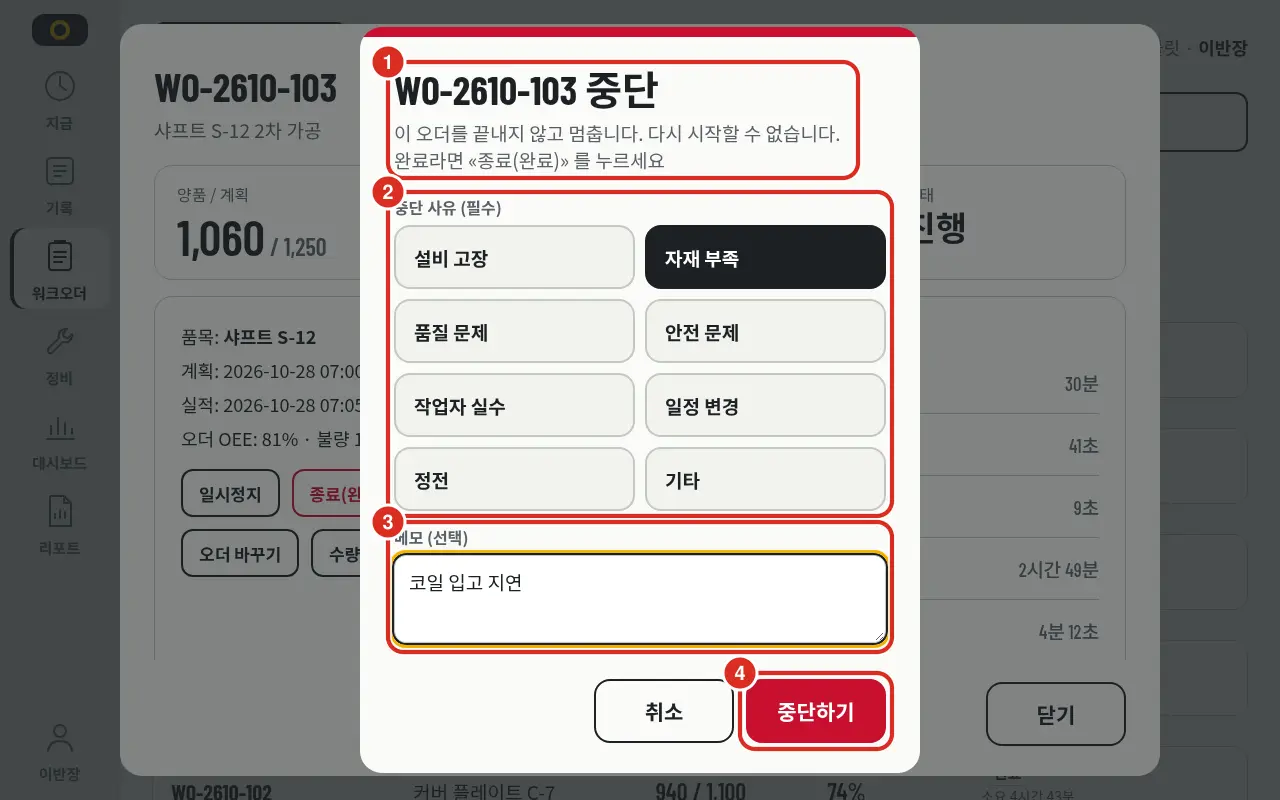
| Number | Location | Function |
|---|---|---|
| ① | Title · Notice | «WO-2610-103 Abort», «Stop this work order without completing it. It cannot be restarted. If completed, use «End (Complete)»» |
| ② | Abort Reason (Mandatory) | Choose one: Equipment Failure · Material Shortage · Quality Issue · Safety Issue · Operator Error · Schedule Change · Power Outage · Other |
| ③ | Note (Optional) | Up to 1,000 characters |
| ④ | Abort | Aborts the order |
- Abort is only available to Foremen and Administrators who have «Work» assignment for that equipment. Those with «View» only scope are blocked. Only active or paused orders can be aborted.
- Removing a waiting order that hasn't started is a «Cancellation» performed by the planning lead on the Platform web.
- Aborted orders are displayed with «Abort Reason: Equipment Failure».
- Possible while disconnected (saved on tablet and sent later).
Time-Based Orders
Orders configured on the Platform to measure progress by time show running time and completion rate instead of quantity.
- Progress is shown as «Running 2 hr 10 min / Std 3 hr». If no standard exists: «No Std».
- If the standard is exceeded: «20 min over standard»; if it's likely to be exceeded: «Estimated 20 min over standard».
- «Estimated Remaining Run» is also displayed. Orders that cannot produce performance or OEE are marked «N/A».
The Report Completion Rate window allows users to record their observed completion rate.
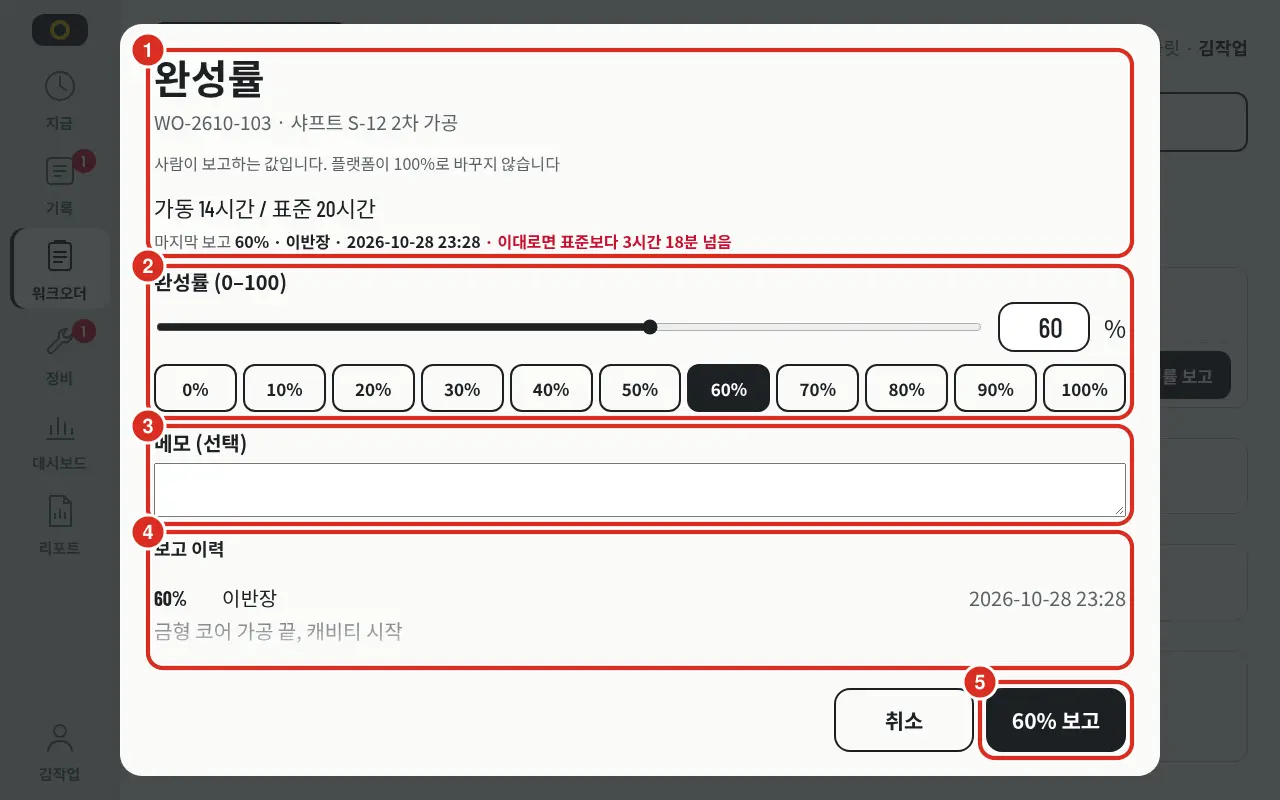
| Number | Location | Function |
|---|---|---|
| ① | Header · Notice | «Completion Rate», order number · name, «This is a user-reported value. The Platform does not automatically set it to 100%». Below: «Running 14 hr / Std 20 hr» and «Last Report 60% · [Name] · Time»; if likely to exceed: «Estimated 3 hr 18 min over standard» |
| ② | Completion Rate (0–100) | Slider · number field · 10% increment buttons (0%~100%). Enter integer from 0 to 100 |
| ③ | Note (Optional) | Up to 1,000 characters |
| ④ | Report History | Previously reported values, reporter's name (employee ID if unknown to app), time, and notes |
| ⑤ | Report | Button showing the entered value (e.g., «Report 60%»). Upon sending, «Reported 60% completion rate» is displayed |
- Opened via the Completion Rate button on «Now», the work order progress row, or order details. The «Last Report» is shown with the reporter's name in the progress row and order details.
- If a value lower than the previous report is entered, «Lower than previous report (60%). This will be recorded as a re-estimated value» is displayed. Entry is not blocked.
- Orders not yet started cannot be reported («Cannot report for order before start»). Orders measured by quantity are not accepted. Orders for equipment assigned as «View» cannot be reported.
- Possible while disconnected. Report time is recorded as the timestamp of the press.
Dashboard
Displays period metrics for equipment or lines. If a line tablet is used or a line is selected, line metrics are shown.
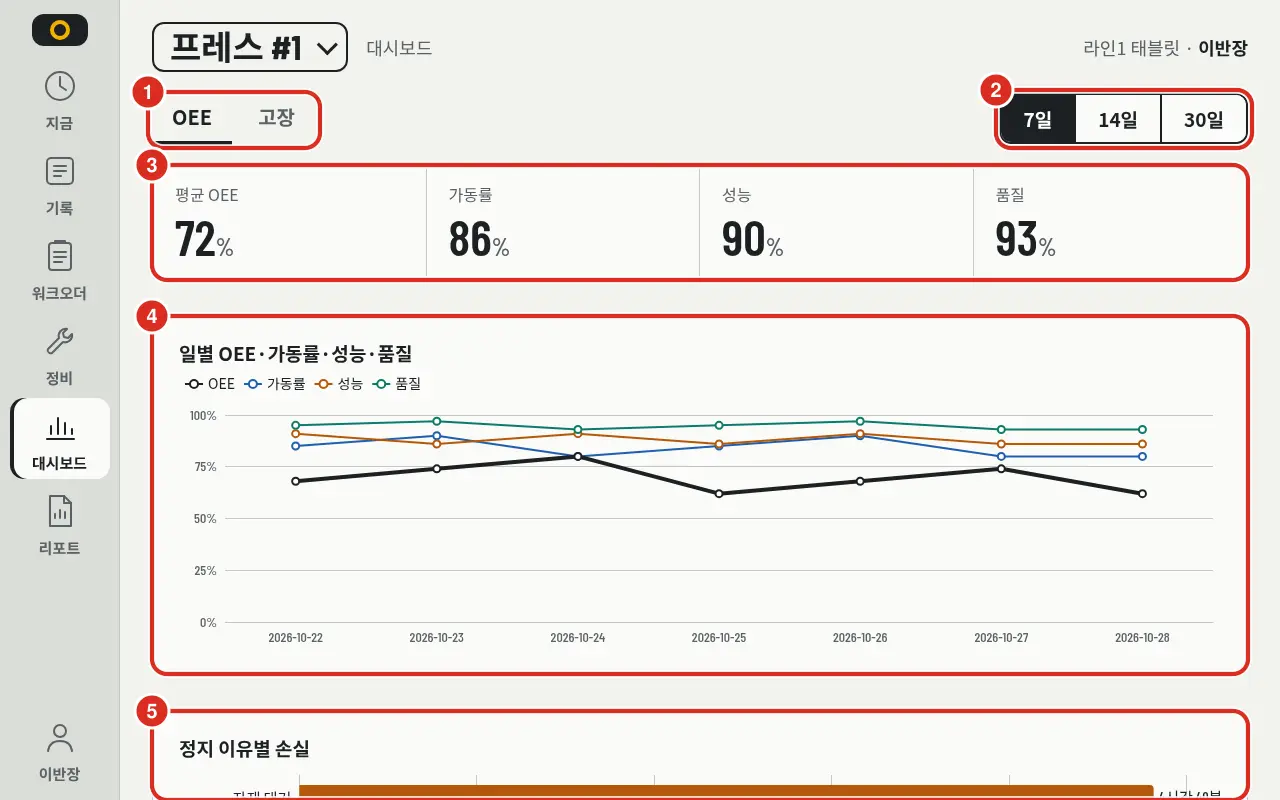
| Number | Location | Function |
|---|---|---|
| ① | Tabs | OEE · Failure |
| ② | Period | «7 Days» · «14 Days» · «30 Days» — View recent history |
| ③ | Metrics | Average OEE, Availability, Performance, Quality |
| ④ | Daily Trend | «Daily OEE · Availability · Performance · Quality» graph |
| ⑤ | Loss by Stop Reason | Pareto graph of causes with longest downtime in the period, sorted descending. «Missing Reason · Stop» indicates stops without a reason. Located at the bottom of the screen |
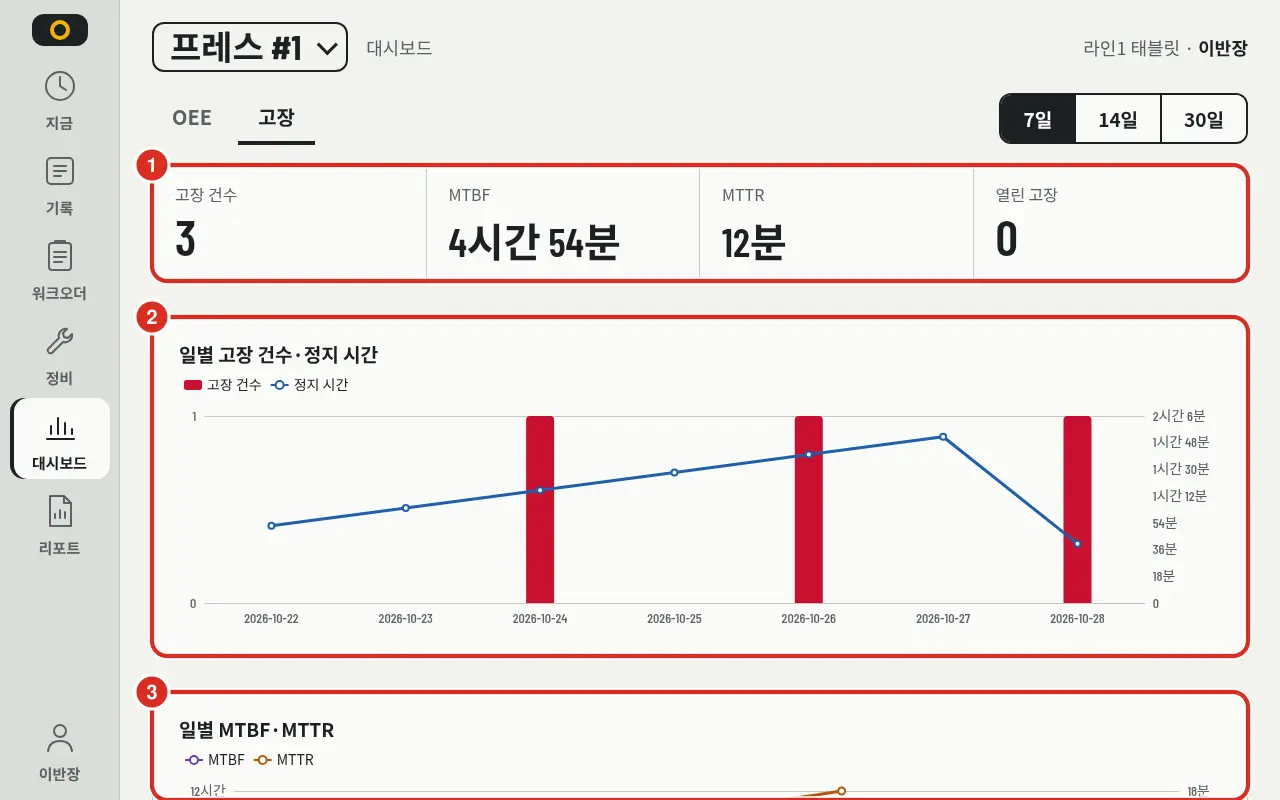
| Number | Location | Function |
|---|---|---|
| ① | Metrics | «Failure Count» · MTBF · MTTR · «Open Failures» |
| ② | Daily Failures | «Daily Failure Count · Downtime» graph |
| ③ | Daily MTBF · MTTR | «Daily MTBF · MTTR» graph. Lines break on days with no data |
Scrolling down reveals the Failure Cause Pareto graph. Cause names come from the Platform failure dictionary. Device codes not linked to the dictionary are grouped as «Unmapped Device Code»; failures with signals but no codes are grouped as «No Code (Signal only)».
- Graphs draw values exactly as provided by the Platform. Failure counts are rounded to integers, with original values shown as «Raw Value N».
- Days without data are blank, not 0. A «No Data» band is displayed; if the entire period is empty, «No data for this period» is shown.
- Loss by Stop Reason and Failure Cause are only drawn when a single piece of equipment is selected. For lines: «Select a single piece of equipment to view».
- To view the line dashboard, the user must have the line itself as part of their assigned scope. If only one equipment in the line is assigned, the line dashboard will not open.
Report
Collects shift, daily, or weekly results on one screen and prints in A4 portrait.
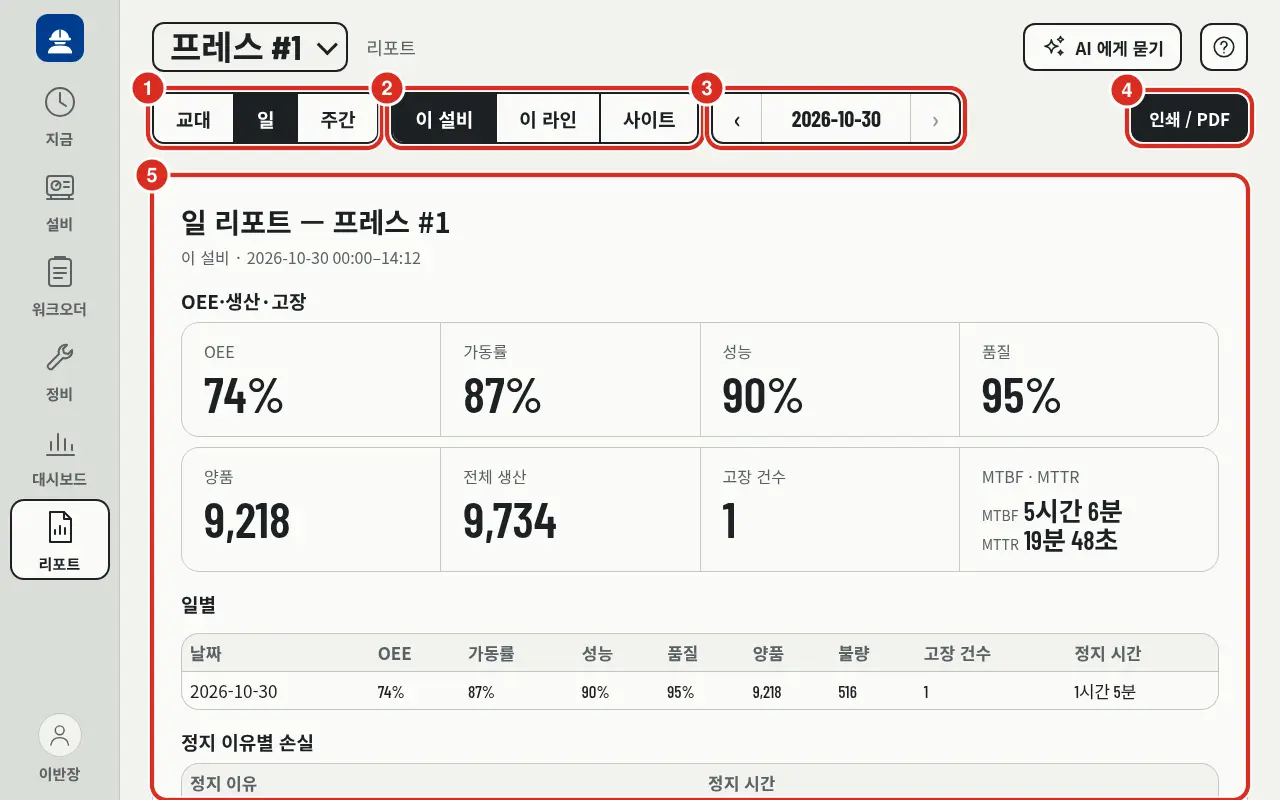
| Number | Location | Function |
|---|---|---|
| ① | Report Type | «Shift» · «Daily» (default) · «Weekly» |
| ② | Scope | «This Equipment» · «This Line» · «Site». Defaults to equipment; line tablets default to line (only line and site are available on line tablets) |
| ③ | Date | Available for Daily and Weekly reports. ‹ (previous day) · Date (tapping opens calendar) · › (next day). › and calendar only go up to today. If today is selected, › is disabled |
| ④ | Print / PDF | Prints in A4 portrait or saves as PDF |
| ⑤ | Content | «Daily Report — Press #1» (type and scope), followed by «This Equipment · 2026-10-30 00:00–14:12» (scope and period). Sections are as follows |
| Type | Period |
|---|---|
| Shift | Current shift (shift window defined by Platform). Cannot be generated without a shift schedule |
| Daily | One selected day |
| Weekly | 7 days ending on the selected day |
For ongoing periods, data is counted up to the current time.
| Section | Content |
|---|---|
| OEE · Production · Failure | OEE · Availability · Performance · Quality, Good · Total Production, Failure Count, etc. |
| Daily | Daily/Weekly only. Table (Date · OEE · Availability · Performance · Quality · Good · Defect · Failure Count · Downtime). Graphs are added for periods of two days or more (Weekly) |
| Loss by Stop Reason | Equipment reports only |
| Ended Work Orders N cases | Work orders ended or aborted during the period (up to 200 cases) |
| vs Plan | Plan Compliance Rate · On-Time Start Rate · On-Time End Rate · Average Delay («Avg 12 min late» · «Avg 5 min early», or «Avg On-Time»), 90th Percentile · Total Over-Plan · Replan Count |
| Defect Cause | Inspection defects (Scrap / Rework) and equipment defects (PLC) are shown separately («Counted separately from inspection defects»). If PLC does not measure, «Unable to measure» is shown instead of 0 |
| Maintenance Summary | Count, Average and 90th percentile of «Wait (Request→Start)» and «Repair (Start→Complete)», by part, by failure mode, «Repeat Failure» |
- When printing, the scope, period, and «Generation Time · User» are repeated in the header and footer of every page. Long reports span multiple pages; table headers are repeated on each page to prevent content overlap. Tablets with dark themes print in light theme.
- «vs Plan», «Defect Cause», and «Maintenance Summary» take time for the Platform to calculate. If delayed, only that section is shown as failed, while others remain visible.
- If the count is too high: «Too many cases; only the first part is aggregated. Please reduce the period».
- To view line or site reports, the user must have the line or site itself as part of their assigned scope.
Ask AI
If the administrator has linked PlantPulse AI, the Ask AI button appears in the header to the left of the ? button (icon only on phones). Tapping opens a panel on the right (full screen on phones), allowing users to ask questions about the current equipment — e.g., «Why did this equipment stop?».
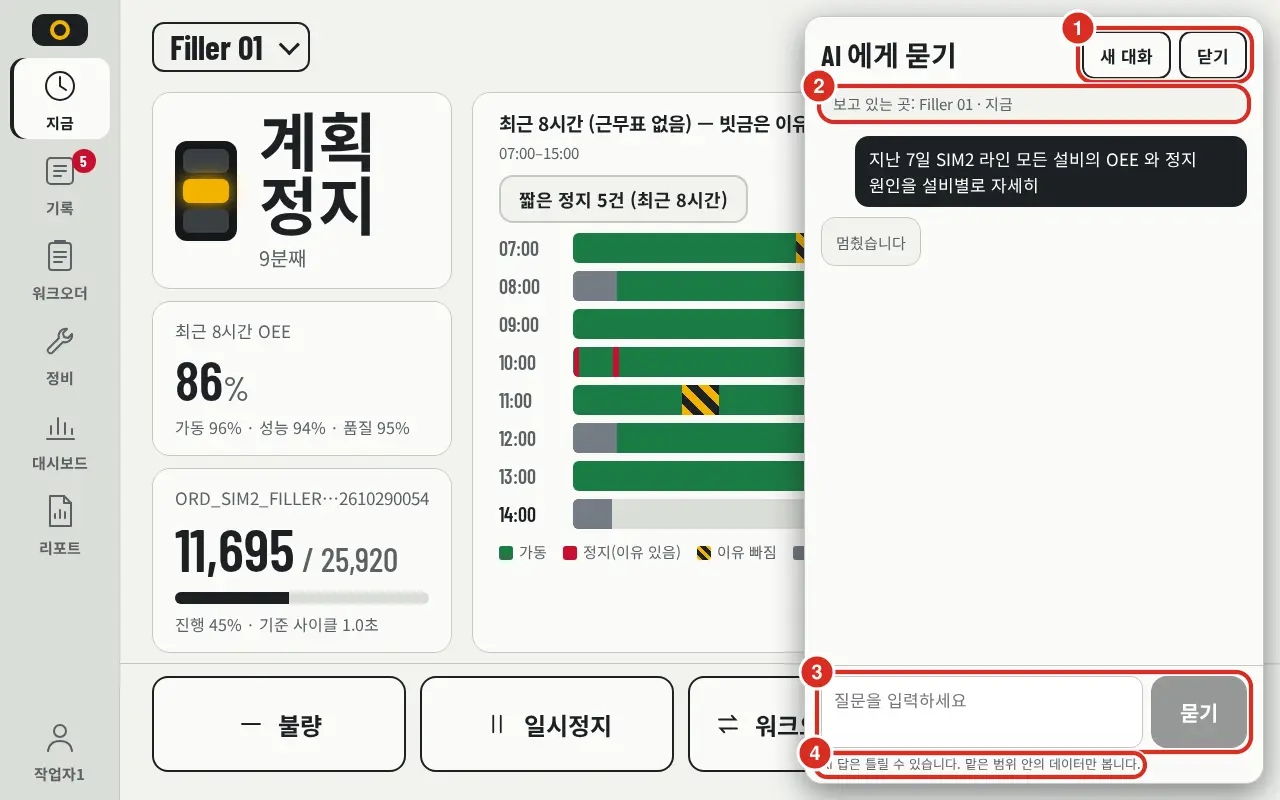
| Number | Location | Function |
|---|---|---|
| ① | New Conversation · Close | Restart conversation or close panel |
| ② | Current View | The equipment and active work order (if present) currently on screen, which are sent to AI with the question — e.g., «Current View: Filler 01 · Now» |
| ③ | Question · Ask | Enter question and tap Ask. Pause is displayed while the answer is being generated |
| ④ | Notice | «AI answers may be incorrect. It only accesses data within the assigned scope.» |
- The AI asks on behalf of the logged-in user. Answers are generated using only data within the user's Assigned Scope. The notice «AI answers may be incorrect. It only accesses data within the assigned scope.» is always visible at the bottom of the panel.
- The current equipment is shown as «Current View» and sent to the AI. If a work order is on screen (active order on the «Now» screen or an open work order sheet), it is also sent. Asking «When will this order end?» while an order sheet is open will prompt a response about that specific work order and equipment. If the equipment is outside the user's scope, «The equipment on the current screen is outside the assigned scope» is displayed. Asking about an equipment by name that is outside the scope will result in the AI stating it cannot access that data.
- Answers are streamed as they are generated. Long responses can be interrupted via Pause, or a fresh query can be started via New Conversation. Questions are limited to 4,000 characters.
- Users with «View» only scope can also ask. The button is hidden for users with no assigned scope.
- The button is hidden if AI is not linked or the version does not support field chat. If AI is unreachable, «Unable to connect to AI. Please try again in a moment» is displayed.
- Conversations require a connection. Requests are not saved on the tablet while offline.
The ? («Help (New Tab)») button to the right of «Ask AI» opens this «Field User Guide» in a new tab. The Korean version opens for Korean screens, and the English version for all others. It is always visible regardless of AI connection.
When Connection is Lost
Work does not stop during Platform restarts (typically 1–3 min) or tablet network outages. Inputs that must be recorded immediately in the field are saved on the tablet and sent in order upon reconnection. The screen displays the last received values. When the connection is restored, the system resumes automatically without needing a refresh.
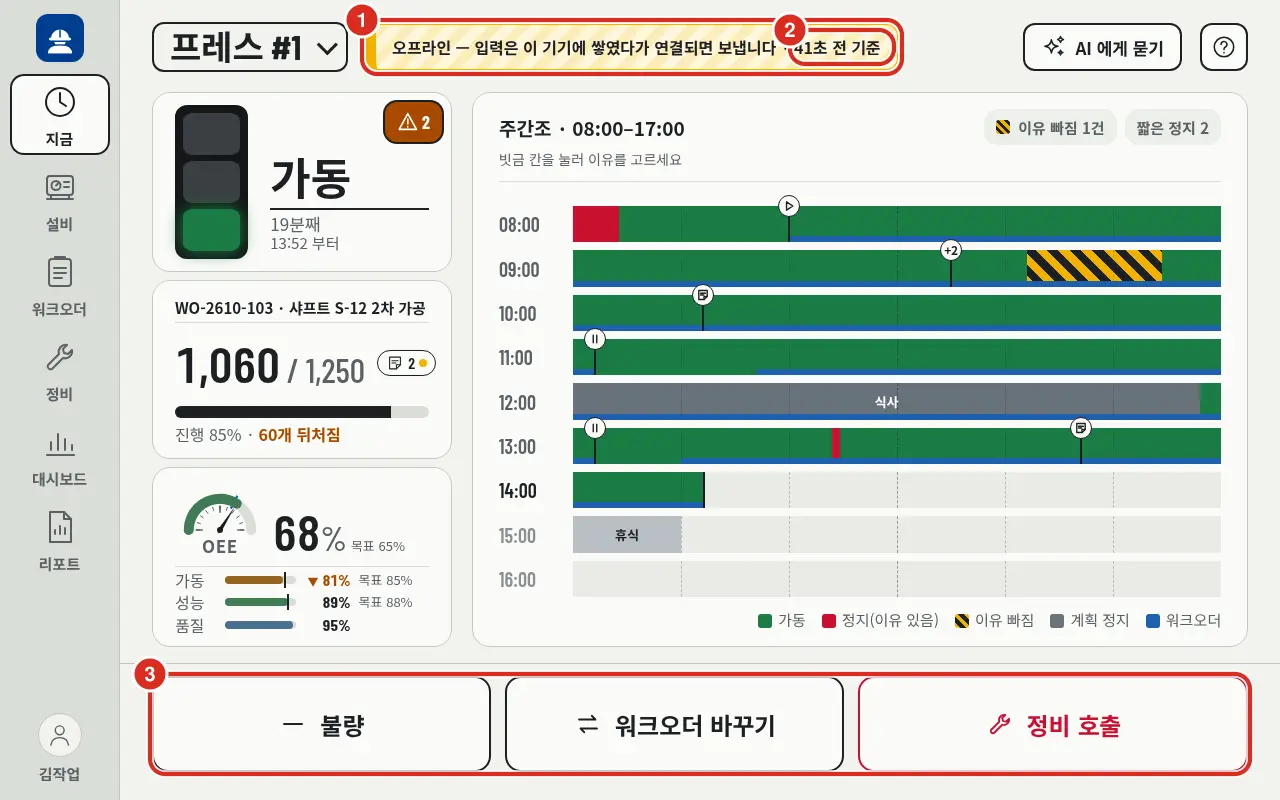
| Number | Location | Function |
|---|---|---|
| ① | Disconnected Band | «Offline — Inputs are queued on this device and will be sent upon connection» displayed in the center of the header |
| ② | Reference Time | Indicates how long ago the on-screen values were received — e.g., «As of 41s ago», «As of 3m ago» |
| ③ | Action Buttons | Pause / Resume buttons are hidden during disconnection. Order transitions are performed within the work order or order details screens |
- While disconnected, entering data triggers an «Offline — Saved to device. Will be sent upon connection» notification, and an «N unsent inputs» row appears below the header. Tapping this opens a list with Send Now and Discard options.
| Action | During Disconnection |
|---|---|
| Record stop reason | Possible — Saved on tablet, then sent |
| Order Start · Pause · Resume · End · Abort | Possible — Saved on tablet, sent in press order. Actual time is recorded as the timestamp of the press |
| Report completion rate | Possible — Report time is recorded as the timestamp of the press |
| Maintenance Call | Possible — «Not yet sent to maintenance» is displayed until transmitted |
| Maintenance Accept · Start Repair · Complete | Not possible — «Unable to connect to server. Try again when connected» |
| Cancel Maintenance Call | Already sent calls cannot be canceled. Calls still on the tablet are deleted from the tablet |
| Defect Recording | Possible — Recorded as the timestamp of the press |
| Cancel Defect Recording | Not possible — Perform after reconnection |
| Work Order Note | Possible — «Note will be sent upon connection» |
| View Screens | Displays last received values with a time stamp (e.g., «As of 3m ago»). Screens never received on this tablet show «No cached values on this device» |
| Quantity Correction | Not possible — Perform after reconnection |
| Automatic prompt for stop reason | Not triggered — Recorded as «Stop without reason» upon reconnection; fill via «Missing Reason» chip |
- Inputs for the same order or stop are sent sequentially, with the earlier input sent first. If a user attempts to change an order while a previous input for that order is still pending transmission, «Inputs for this order are awaiting transmission» is displayed.
- If another user corrected the data first, the input is marked «Corrected by another user»; if rejected by the server, it is marked «Rejected». Subsequent inputs for the same order or stop are also halted. These must be verified and discarded.
- Up to 1,000 inputs can be queued on the device. Once full, the system stops accepting new inputs rather than discarding old ones.
- Queued inputs are unique to that tablet and do not follow the user to other tablets.
- If the Platform root certificate is missing from the tablet, «Offline features cannot be enabled for this address» is displayed. In this case, the app cannot be reopened while offline; notify the administrator (Root Certificate).