Display Your First Equipment Data on Screen
Starting from an empty Platform, we go through equipment data appearing on your screen end-to-end.
No installation required — you can follow along right now with a public demo. Deploying to your own server comes after you've been through this once.
The path is: Register Site → Connect Edge → Configure Model. Once this pipeline is open, everything else is repetition.
There is a public demo — https://demo-platform.plantpulse.io (admin / admin123!).
All screenshots below are captured from this demo. On the Edge side, use
https://demo-edge.plantpulse.io alongside it.
Each step has a short silent video. Skim the videos before reading the text to get familiar with the screens.
The demo runs with the default locale (en). To use it in Korean, install with
PP_LANG=ko. Below, screen names that appear in English are bolded with Korean equivalents beside them.
Step 1 — Register a site
Go to Factory > Model (/model/index) in the left menu. If nothing exists yet, you see this:
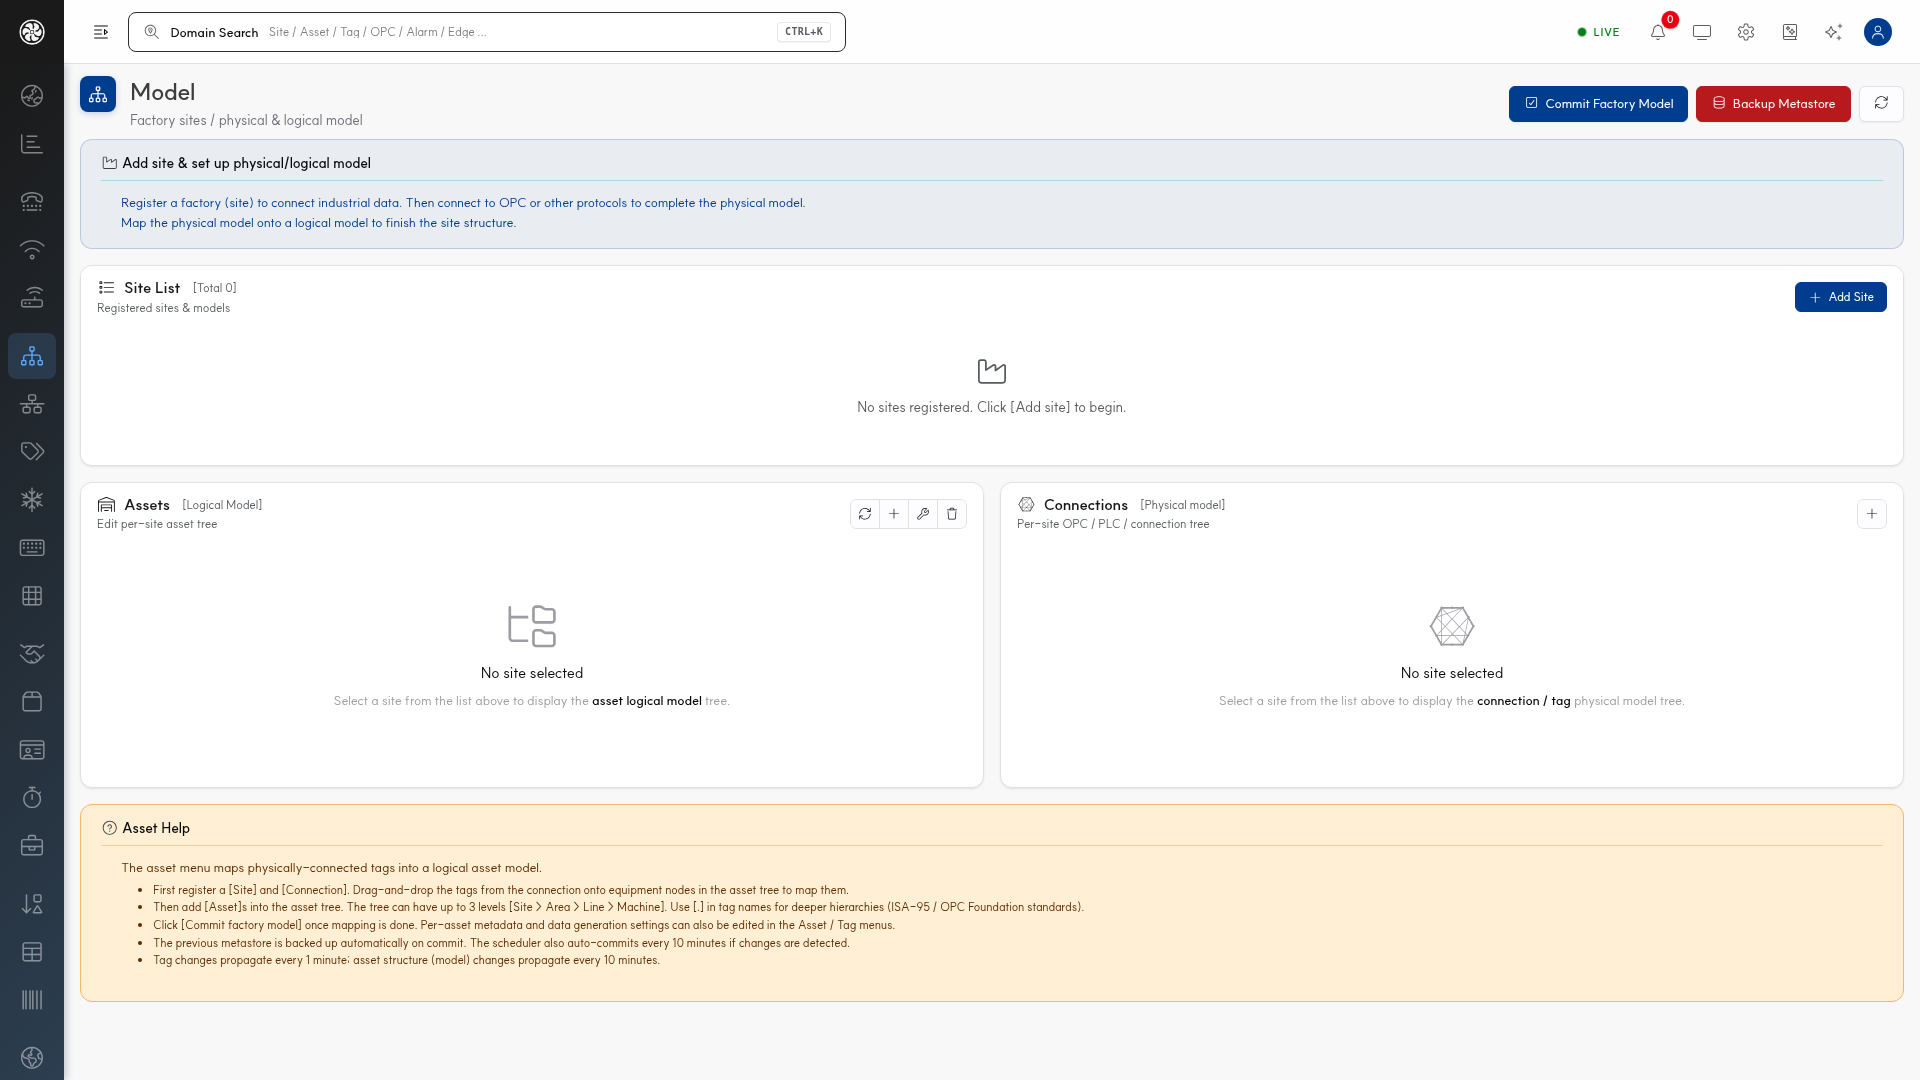
The guidance box tells the order as it is — "Register a factory (site) → connect to OPC or another protocol to complete the physical model → map the physical model to a logical model."
Click Add Site on the right to open the registration form.
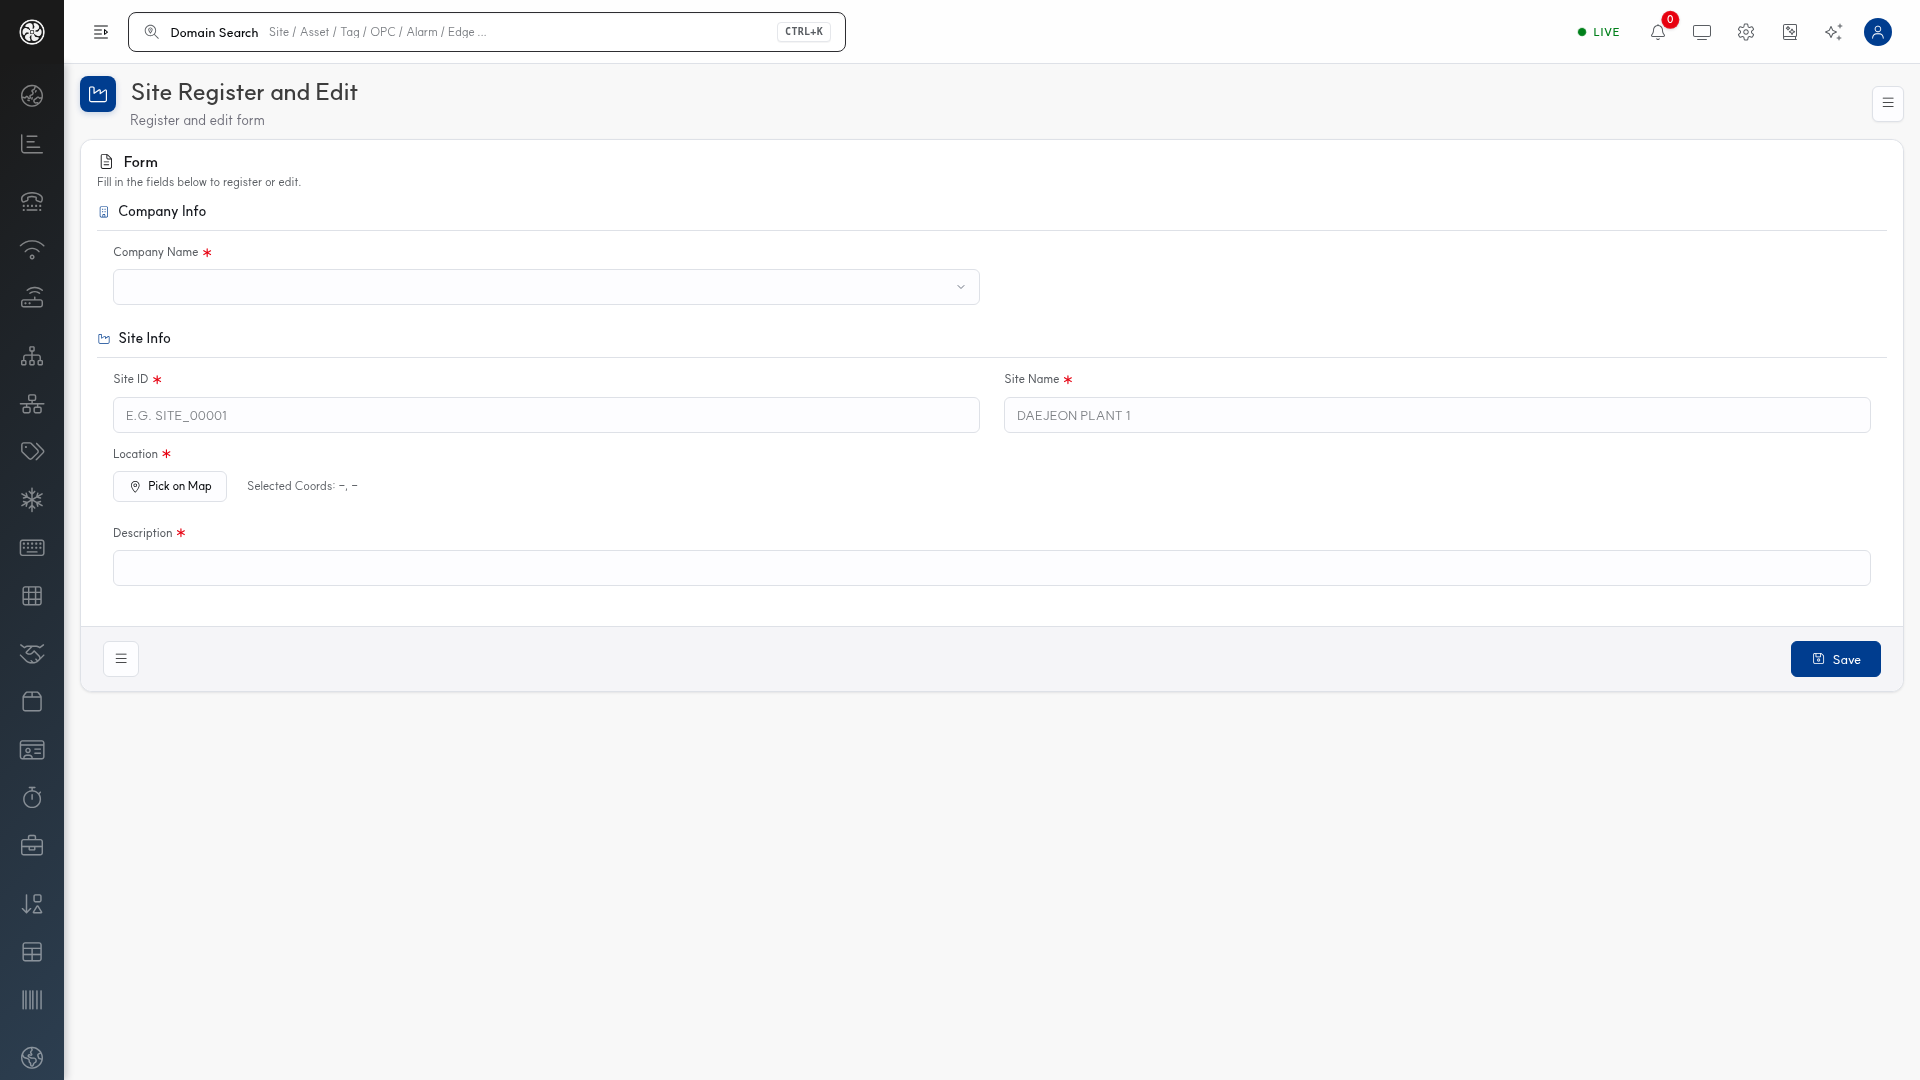
| Field | Required | Content |
|---|---|---|
| Company Name | ✱ | Select a company |
| Site ID | ✱ | Example shown as E.G. SITE_00001. Letters, numbers, and _ only |
| Site Name | ✱ | Human-readable name (e.g., DAEJEON PLANT 1) |
| Location | ✱ | Pick coordinates with Pick on Map |
| Description | ✱ | Description |
Location and Description are also required (✱). The form will not save if you skip the map click.
This ID is embedded throughout tags, APIs, and reports. Establish naming rules before registering → Domain ID Rules.
Step 2 — Connect the Edge
Data is pushed up by the Edge gateway. You don't manually create tags in the Platform; the data collected by the Edge flows up. That's why connection comes before the model.
For gateway-side setup, follow the Edge tutorial. Once the gateway
has the Platform address and token configured, it appears in the Platform under
Connectivity > Edge (/edge/index).
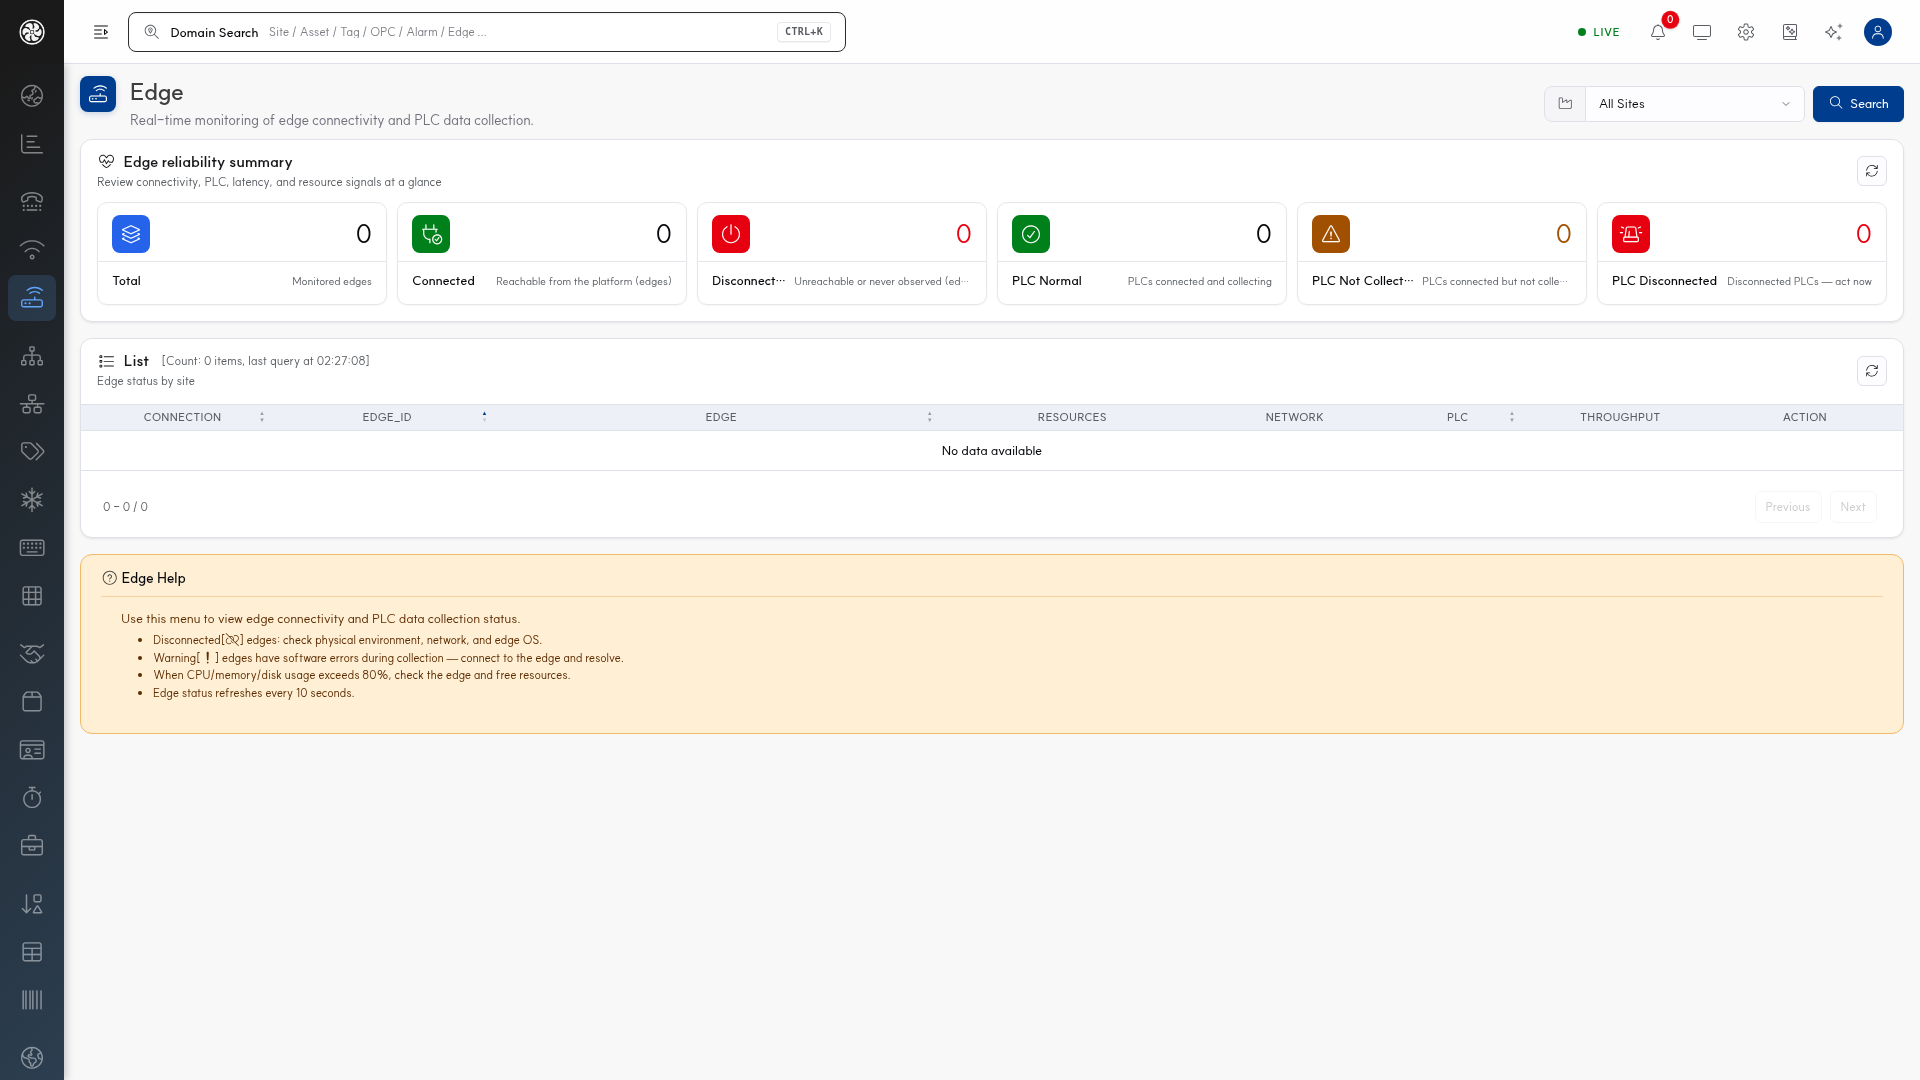
The top six cards are your first checkpoint.
| Card | Meaning |
|---|---|
| Total | Number of Edges being monitored |
| Connected | Edges reachable from the Platform |
| Disconnected | Edges unreachable or never seen |
| PLC Normal | PLCs connected and collecting |
| PLC Not Collecting | PLCs connected but not collecting |
| PLC Disconnected | Disconnected PLCs |
When you see Total 1 · Connected 1 · PLC Normal 1, you pass.
The Edge Help box at the bottom tells you: for disconnected Edges, check the physical environment, network, and Edge OS; for warnings, check for software errors during collection; and for CPU, memory, or disk over 80%, check resources.
The list columns are CONNECTION · EDGE_ID · EDGE · RESOURCES · NETWORK · PLC ·
THROUGHPUT. Detailed reading instructions are in Connection Management.
Step 3 — Configure the model
Once data starts flowing, you attach it to your equipment structure. Without this, data exists but you don't know "which equipment or what parameter."
Go to Factory > Asset (/asset/tree/index).
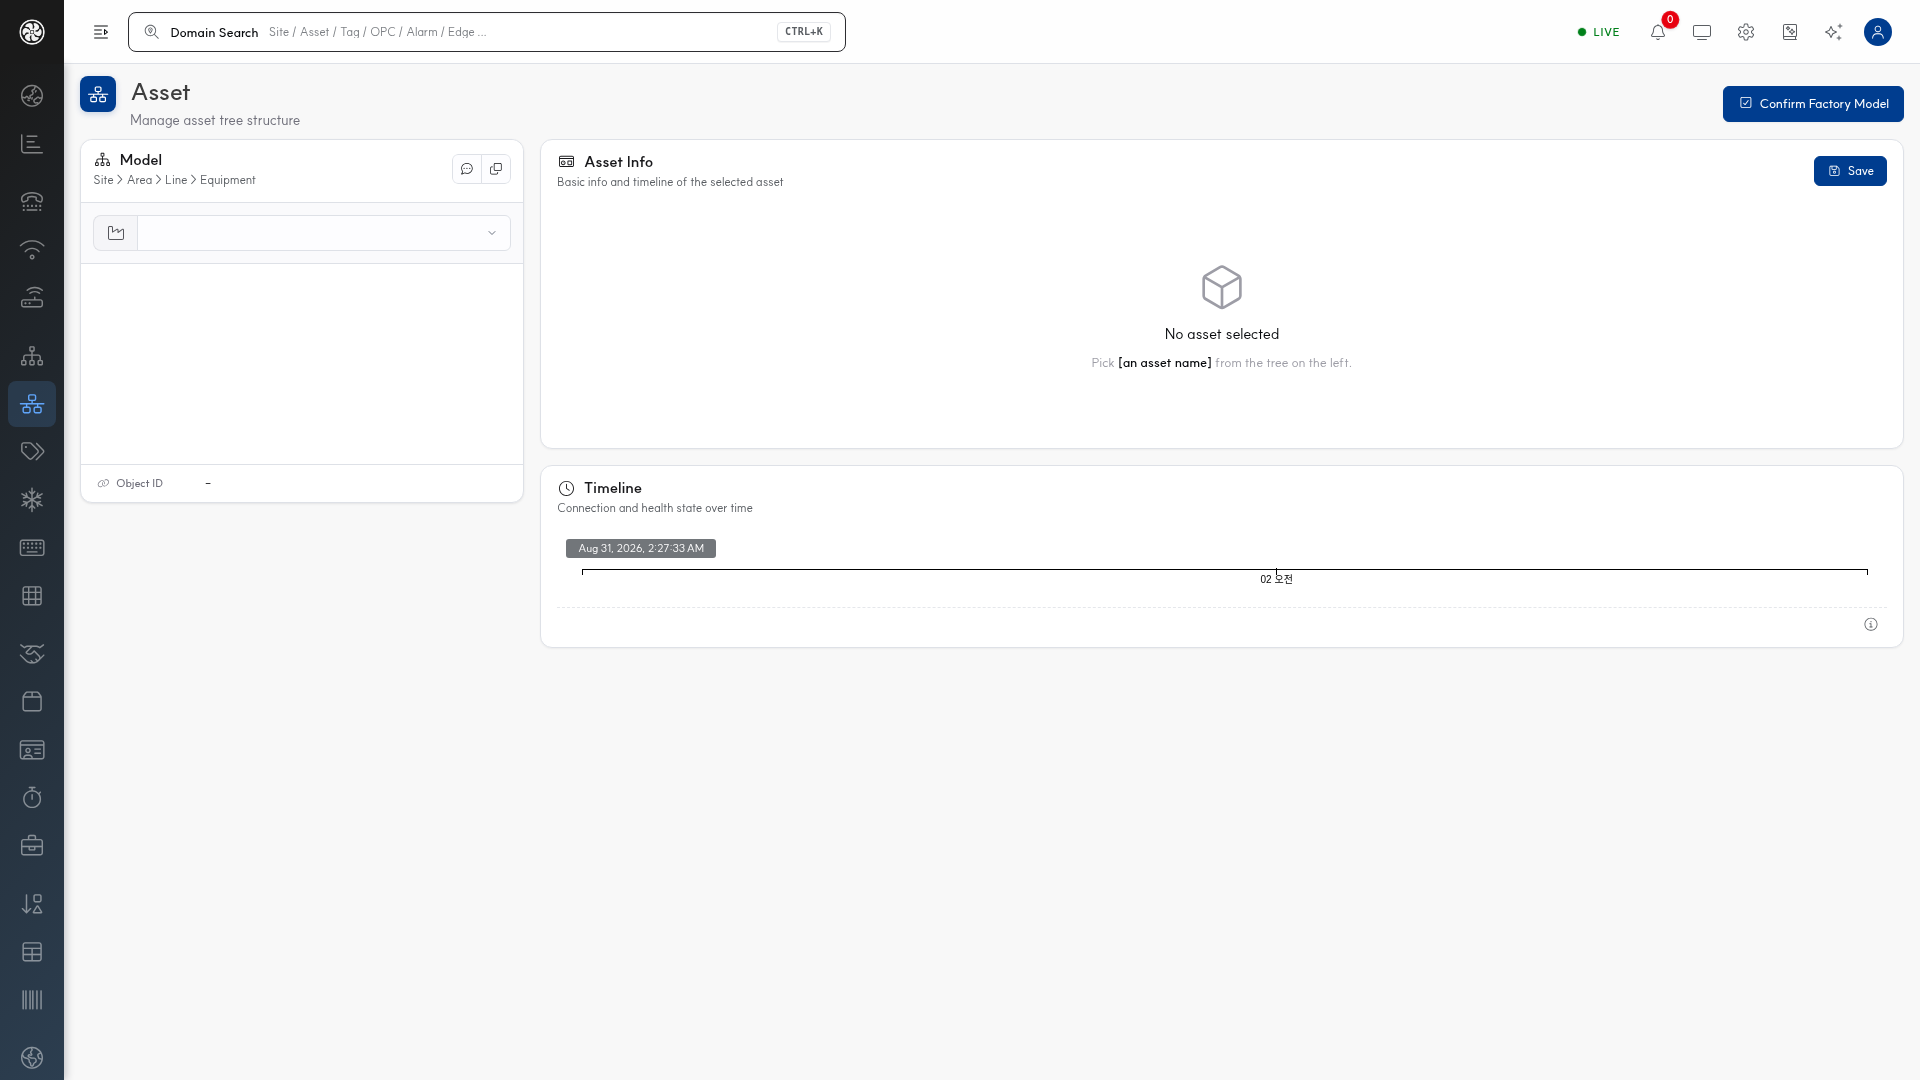
The hierarchy in the left Model panel is Site › Area › Line › Equipment. You build top-down.
| Level | Meaning | ID Example |
|---|---|---|
| Site | Factory or business location | Created in Step 1 |
| Area | Zone | ASSET_<site>_A_<number> |
| Line | Production line | ASSET_<site>_L_<number> |
| Equipment | Physical equipment | Under a line |
When you select an asset, the right Asset Info pane shows details and Timeline (connection and health status history).
Finally — Confirm Factory Model
Click Confirm Factory Model at the top right.
This step reflects registered sites, assets, and tags to the event rules engine. Without it, states, aggregations, and event rules are never created, leaving dashboards and alarms empty.
⚠️ Conversely, don't click it often — there is a cost to rule re-registration. Complete all changes, then click once.
If new rules appear in CEP > Statement afterward, you're good.
Step 4 — Verify data is flowing
This is your second checkpoint. If tag values refresh in Equipment > Data Query (/asset/data/index)
or Data > Trend (/storage/index), you succeed.
If nothing appears, narrow it down in this order:
| Check | If not, then |
|---|---|
| 1. Are values visible on the Edge side? | Go to Edge tutorial step 5 |
| 2. Is PLC Normal shown in Connectivity > Edge? | Gateway–PLC issue |
| 3. Are tags attached to the equipment? | Verify in Factory > Tag (/tag/index) |
| 4. Did you click Confirm Factory Model? | Go back to step 3 and click it |
Most "I registered everything but the screen is blank" cases come down to this.
Step 5 — Set up one alarm
Once data flows, you set conditions. Go to Alarm > Alarm (/alarm/index) and configure thresholds →
Alarm Management.
At this point, you've completed one full loop: collection → storage → monitoring.
You're done
| Next | Documentation |
|---|---|
| How to run it in your organization | Work Process |
| Add more equipment | Factory Management |
| Transform and integrate data | Flow |
| Connect to external systems | API User Manual |
| Pre-handoff checklist | Change Initial Password |